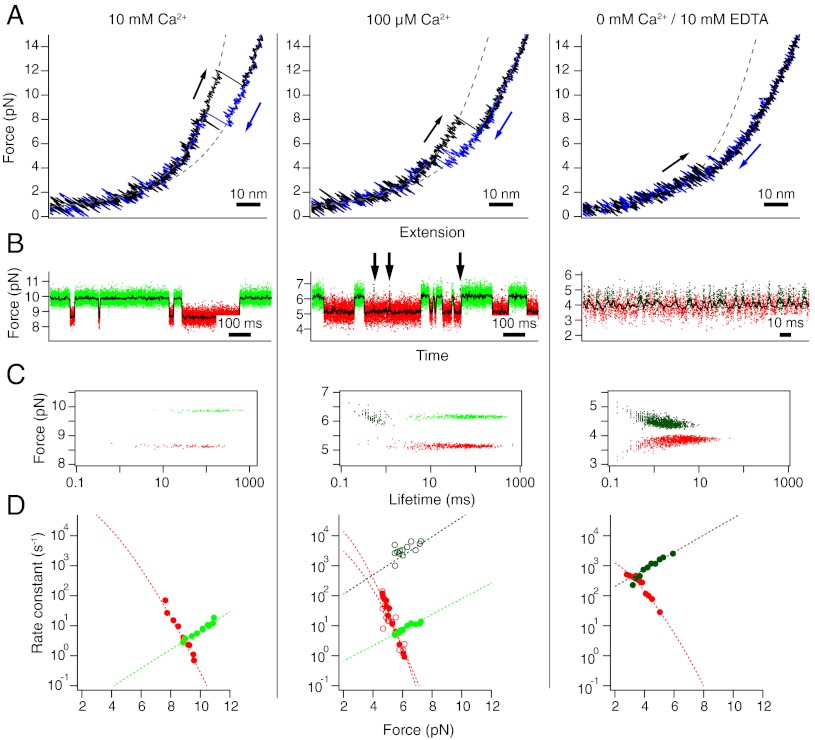
Fig. 4.
The C-terminal domain at calcium concentrations of 10 mM (Left), 100 μM (Middle), and 0 mM (Right). Shown are data from three individual molecules. (A) Stretch (black) and relax (blue) cycles at 500 nm/s. Dashed lines are fits to the folded and unfolded stretches. (B) Constant-trap separation traces at intermediate forces. Arrows indicate occurrences of short-lived folded states incompatible with lifetimes of the light-green folded state. The raw data are colored according to the classification by a Hidden-Markov model. Red: unfolded state, light green: domain folded with calcium bound, dark green: domain folded with no calcium bound. (C) Force-lifetime scatter plot for the traces shown in (B). Each dot is represented by the average force of one dwell plotted against its lifetime. (D) Force-dependent folding (red) and unfolding (green) rate constants. Dotted lines are fits to the data.

