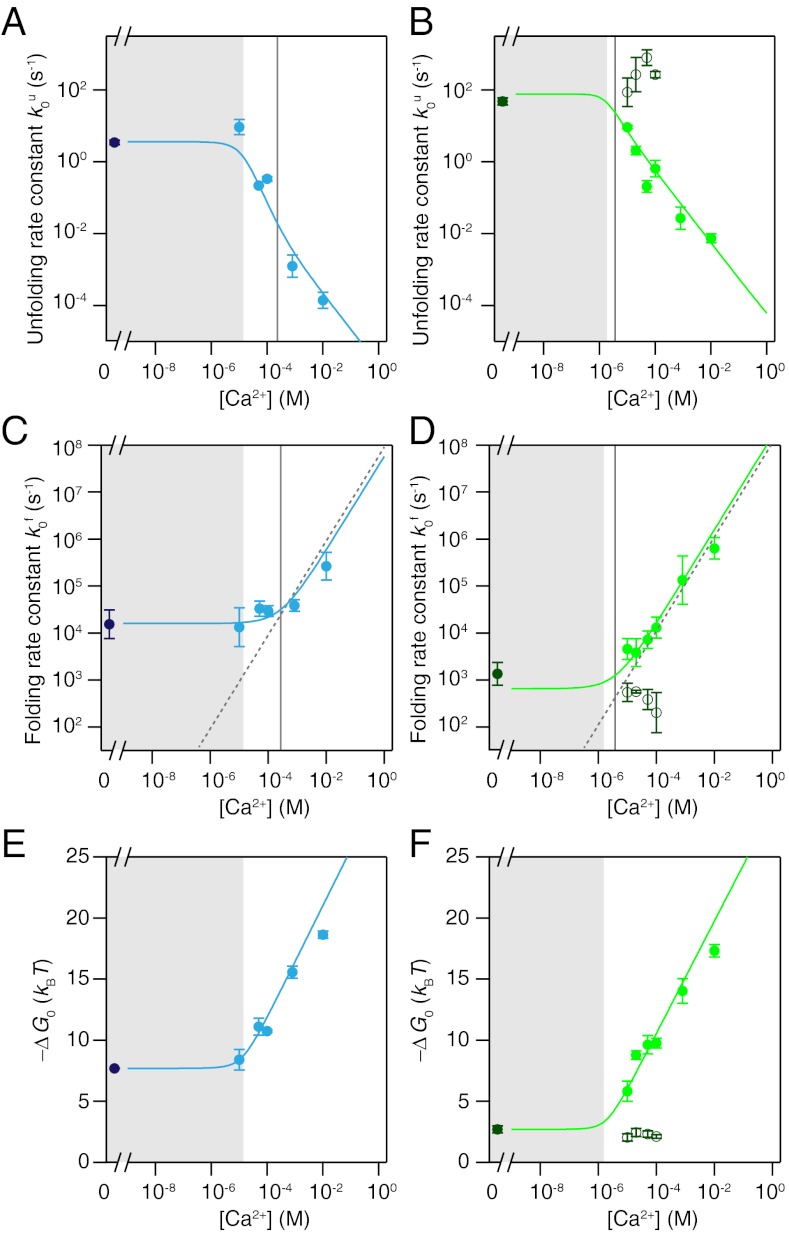
Fig. 5.
Kinetic and equilibrium information for CaM12 (left) and CaM34 (Right) at varying calcium concentrations. (A, B) Zero-force extrapolated unfolding rate constants. (C, D) Zero-force extrapolated folding rate constants. (E, F) Equilibrium free energies of folding. Dashed lines in (C) and (D) are the calculated diffusion-limited on-rates for one calcium ion assuming a rate limit of 108 M-1 s-1. Filled circles represent averages over several molecules at a particular concentration. Empty circles in (B, D, F) are values for the short-lived state as shown in Fig. 4, Middle. Error bars represent the SEM. Colored continuous lines are fits to the data. Vertical grey lines in (A–D) represent the value of KTS1 as obtained from the fit. The shaded areas are the concentration range below  , where the protein is predominantly ligand-free.

