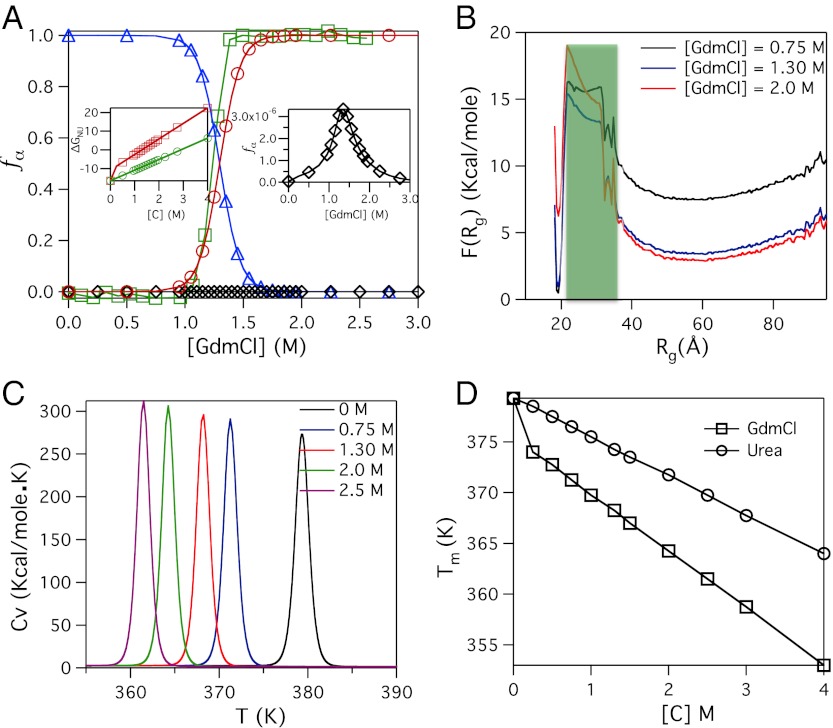
Fig. 2.
Denaturant effects on GFP: (A) Dependence of fα([C]) (α = NBA, INT, and UBA) as a function of GdmCl concentration. Blue triangles, black diamond, and red circles are used for fNBA([C]), fINT([C]), and fUBA([C]), respectively. The experimental data for fraction of protein in UBA as a function of [C] is shown in green squares. The right inset shows the low probability of populating the intermediate species. The left inset shows the linear variation of free energy difference between the NBA and UBA, ΔGNU, as a function of denaturant concentrations. The data in red and green are for GdmCl and Urea, respectively. (B) Free Energy profiles, F(Rg), of GFP as a function of Rg show the population of a thermodynamic intermediate corresponding to the shaded green area. (C) Heat capacity as a function of GdmCl. (D) Variations in the melting temperature, corresponding to the peak in Cv(T), as a function of denaturant concentrations. The upper curve is for urea and the lower one corresponds to GdmCl.

