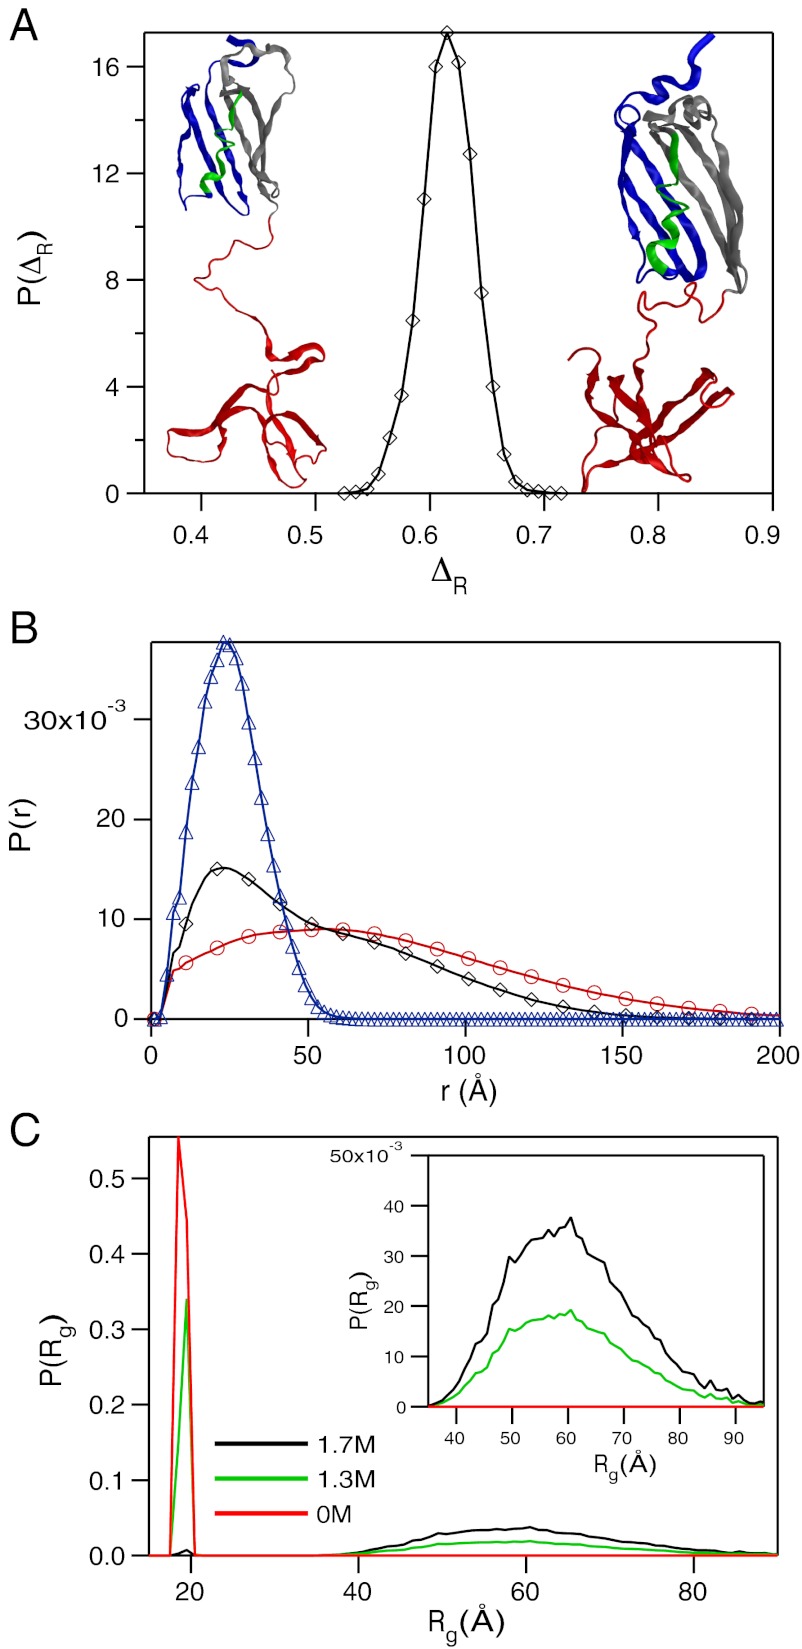
Fig. 3.
(A) Distribution of P(ΔR) where ΔR is the relative accessible surface area (see text for details) in one of the kinetic intermediates with attributes similar to that found under equilibrium. The typical structure sampled at equilibrium is on the left whereas the structure on the right represents a conformation obtained in the kinetic simulation in the EQL pathway. (B) Distribution, P(r), as a function of r, the distance between a pair of sites for NBA (triangles), INT (diamonds), and UBA (circles) computed using conformations sampled at equilibrium with [C] = 0. (C) Distribution of Rg as a function of GdmCl concentration. The midpoint of the transition is Cm = 1.3 M. The inset shows P(Rg) at large Rg.

