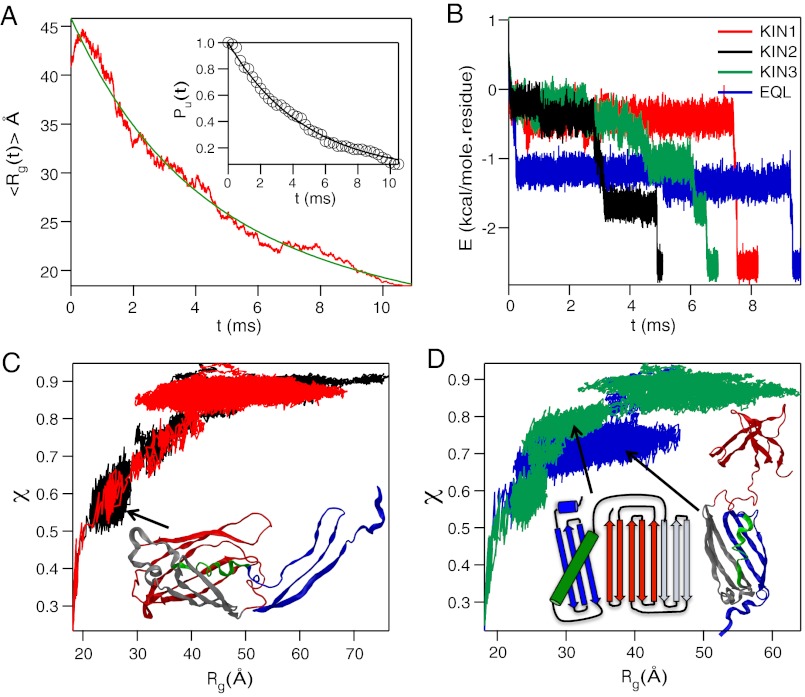
Fig. 4.
GFP folding kinetics. (A) Time (t) dependent decrease in  . The solid line in green is a two exponential fit to the data. The inset shows the fraction of trajectories unfolded, Pu(t) as function of t, with the solid black line being an exponential fit. (B) Total energy E as a function of t for folding along four pathways. A representative trajectory for each pathway is shown. (C) Dynamic profiles generated using the folding trajectories in terms of χ and Rg for KIN1 and KIN2 in red and black respectively. The ribbon diagram of the kinetic intermediate in KIN2 shows that β1 - β3 sheets are not packed onto the rest of the GFP barrel structure. (D) Plot of χ as function of Rg for folding pathways KIN3 and EQL are in green and blue, respectively. Interactions involving the helix and β1 - β3 in the first intermediate sampled in KIN3 with the rest of the barrel are absent. The second intermediate in KIN3 is similar to the one observed for KIN2. In the intermediate populated in the EQL pathway, the C-terminal β-sheets do not interact with the ordered N-terminal strands β1 - β6.

