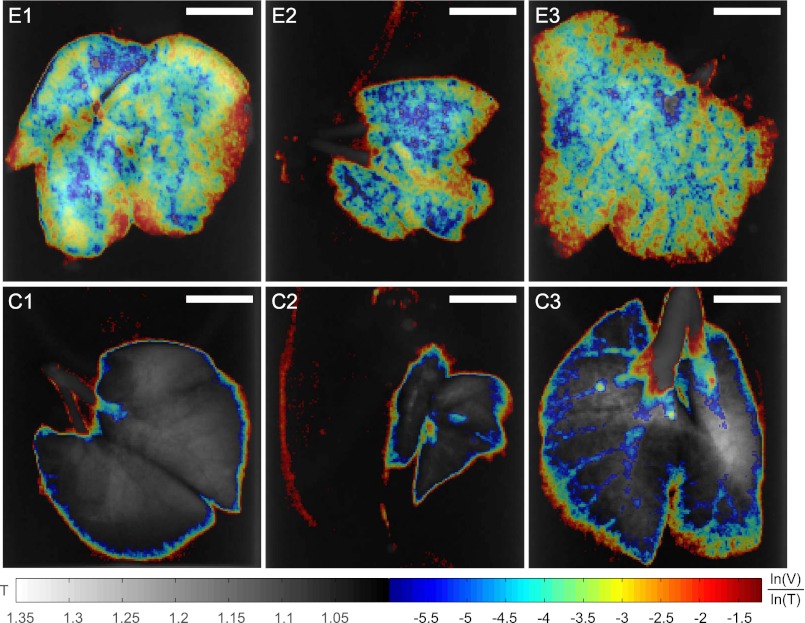
Fig. 6.
Multimodal projections of three emphysematous lung samples (E1, E2, E3) and three control lung samples (C1, C2, C3). To visualize the apparent differentiation of healthy and emphysematous lungs from the scatter plot (Fig. 3), we propose using threshold values on the quotient of the logarithm of dark-field contrast and transmission values ln(V)/ln(T) = −6 and ln(V)/ln(T) = −1.2 (dotted green lines in Fig. 3). In single projections, the corresponding pixels have been superimposed on the conventional transmission contrast image with their color representing ln(V)/ln(T). Standard transmission is depicted in the linear gray scale with transmission values (with respect to water) ranging from 1 to 1.35. The material-dependent quotient ln(V)/ln(T) is displayed in jet colors ranging from −6 to −1.2, where higher values (yellow, red) correspond to lower scattering at similar transmission and thus larger mean alveoli diameter. (Scale bars: 5 mm.)

