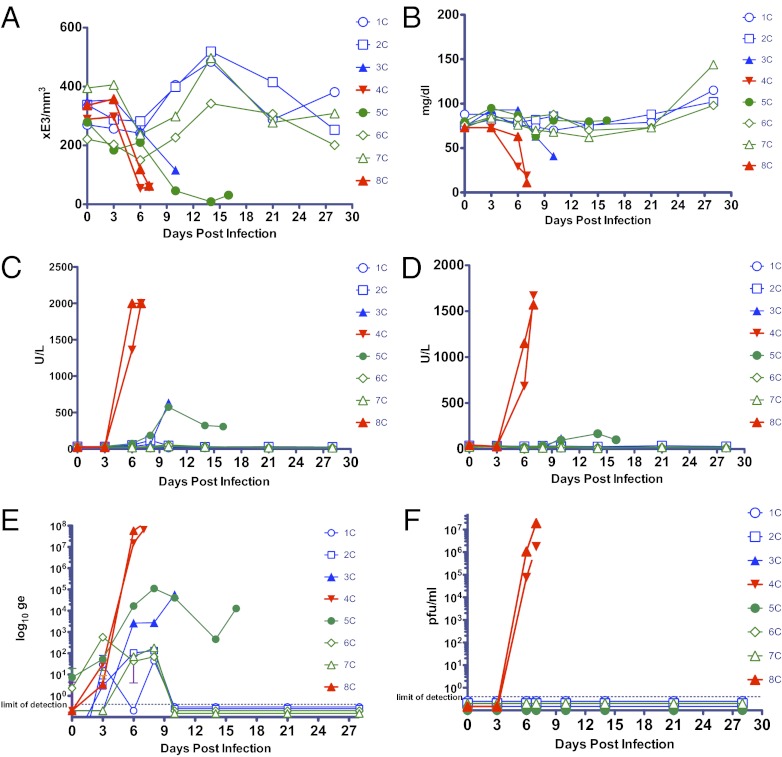
Fig. 3.
Clinical analysis and viral titers for the duration of study. Changes observed on days 0, 3, 6, 10, 14, 21, and 28 (additional day of euthanasia measurement on day 16 for primate 5C; additional day 8 chemistry analysis for all primates) for (A) platelet counts; (B) glucose; (C) AST; and (D) ALT. (E) RT-PCR–derived genomic equivalents (ge) and (F) viral titer as calculated by agarose plaque assay. All samples were analyzed via RT-PCR and plaque assay. Error bars (too small of an error to be seen for most points) in E and F represent SD (n = 3). Open symbols represent animals that survived, and filled symbols represent animals that succumbed to infection. Blue symbols indicate treatment initiation 24 h p.i. and green symbols 48 h p.i.; red indicates controls.

