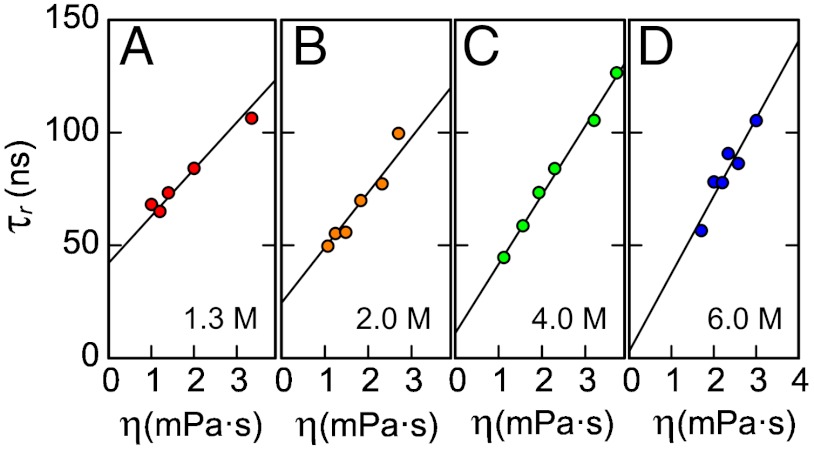
Fig. 2.
Solvent viscosity (η) dependences of chain reconfiguration times of terminally labeled Csp at different GdmCl concentrations (indicated in the lower right of each panel). Based on Eq. 2, data were fit with  (solid lines, see Supporting Information), where the mean-squared end-to-end distances at a given GdmCl concentration,
  , are obtained from corresponding FRET efficiency histograms. a is a global fit parameter for all GdmCl concentrations, and the values of the internal friction time, (τi)GdmCl, correspond to the intercepts.

