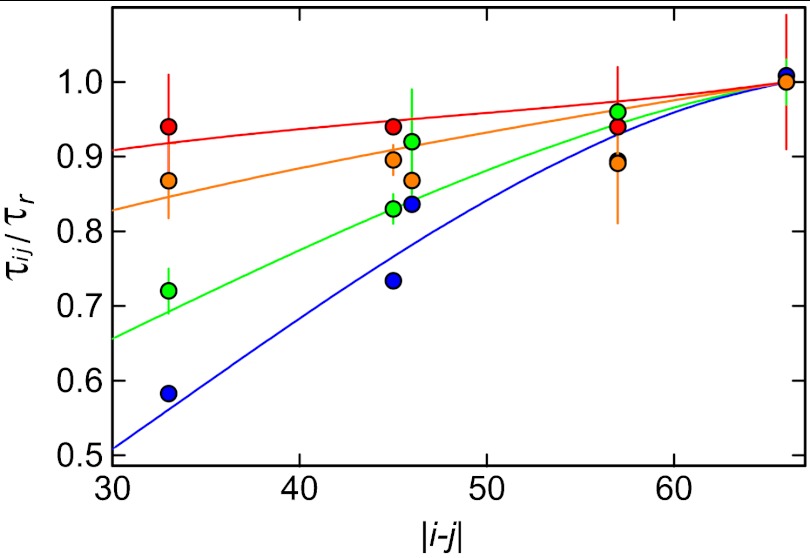
Fig. 3.
Dependence of chain dynamics on the length of the polypeptide segment probed (Table S1) in unfolded Csp at different GdmCl concentrations (1.3 M: red, 2.0 M: orange, 4.0 M: green, 7.0 M: blue). Error bars represent standard deviations estimated from independent measurements where available. The reconfiguration time, τij, for donor and acceptor in positions i and j normalized by the end-to-end reconfiguration time, τr, is shown as a function of the segment length, |i - j|. The fits with the modified RIF model (Supporting Information) used to determine the characteristic timescale associated with internal friction, τi, are shown as solid lines.

