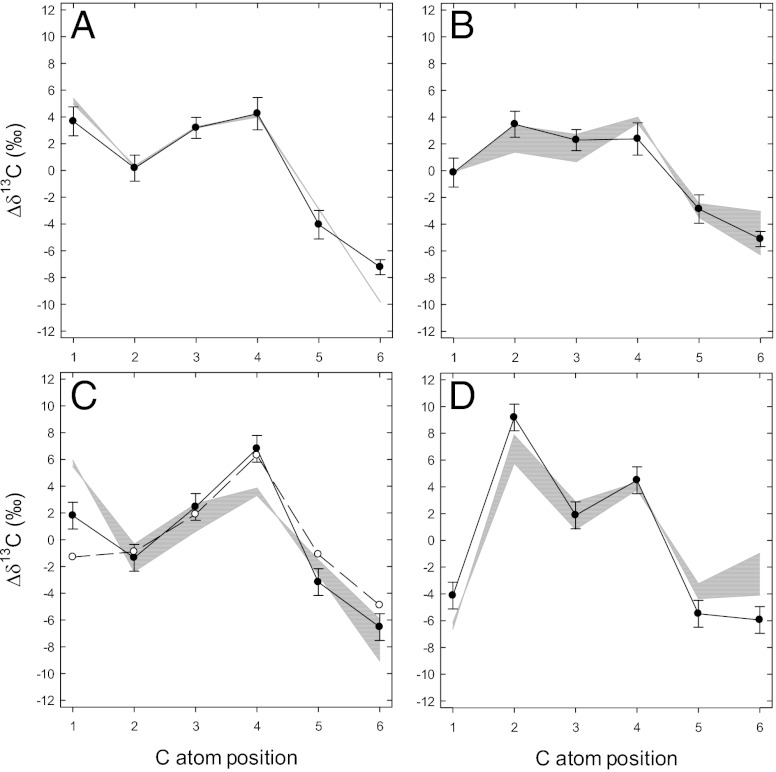
Fig. 1.
Intramolecular 13C patterns in glucose measured by site-specific 13C NMR. (A–D) Leaf starch (A), wheat grain starch (B), glucosyl moiety of sugar beet sucrose (C), and fructosyl moiety of sugar beet sucrose (D). Mean ± SE, n = 6. Experimental values (●, ○) are expressed as deviations from the molecular average, Δδ13C (see main text). Shaded areas indicate modeled intramolecular patterns with different parameter values used for calculations: starch synthesis within 10–50% of net carbon fixation in leaves (A) or contribution of leaf starch to the buildup of reserves within 50–90% (L = 0.1–0.5) (B–D). In C, values from Rossmann et al. (5) are indicated (○).

