Fig. 1.
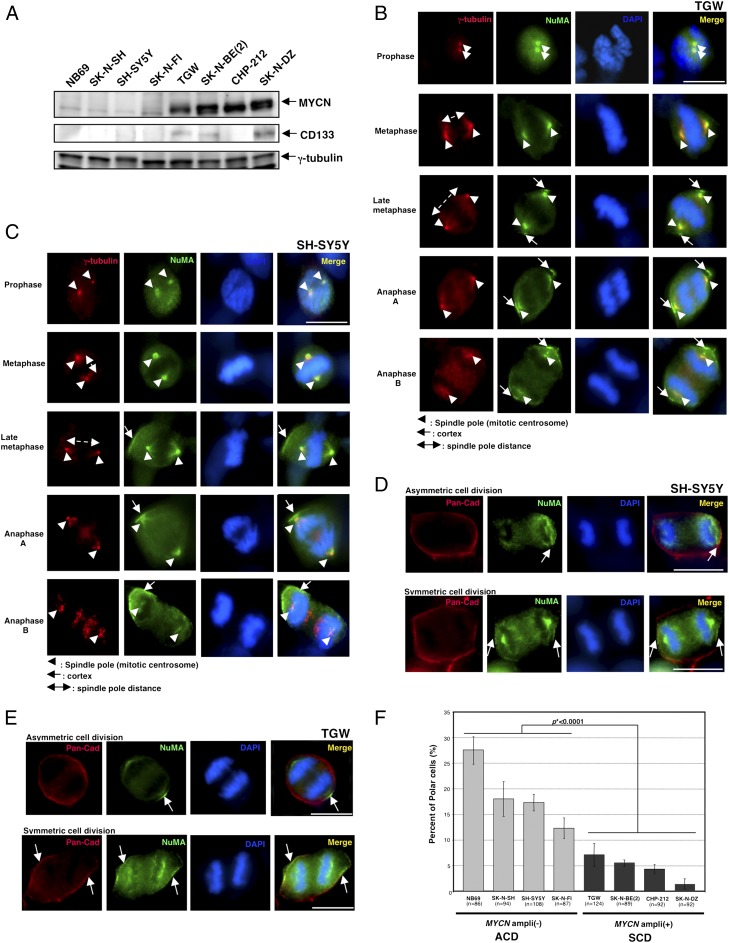
Asymmetric cell division (ACD) occurs in human neuroblastoma cells with a normal MYCN copy, but not in the cells with MYCN amplification. (A) Immunoblot of MYCN and CD133 in human neuroblastoma cells. Both MYCN and CD133 expressions were detected in the MYCN-amplified cells, whereas the cells with a normal MYCN copy showed no expression of MYCN and CD133. Immunoblot of γ-tubulin served as a loading control. (B) Representative images of symmetric distribution of NuMA during the late stage of mitosis in TGW cells. γ-Tubulin is red, NuMA is green, and DNA is blue. Arrowheads show spindle poles. Arrows show the distribution of NuMA on the cell cortex. Double arrow shows a spindle pole distance. (C) Representative images of asymmetric distribution of NuMA during the late stage of mitosis in the SH-SY5Y cells. Centrosome is red, NuMA is green, and DNA is blue. Arrowheads show a spindle pole. Arrows show the distribution of NuMA on the cell cortex. Double arrow shows spindle pole distance. (D) Representative images of ACD at anaphase in the SH-SY5Y cells. Pan-cadherin (Pan-Cad) is red, NuMA is green, and DNA is blue. Arrows show the distribution of NuMA on the cell cortex. (E) Representative images of ACD and symmetric cell division (SCD) at anaphase in TGW cells. Pan-cadherin (Pan-Cad) is red, NuMA is green, and DNA is blue. Arrows show the cell cortex distribution of NuMA. (F) Quantification of cells with ACD in human neuroblastoma cells during the late metaphase and anaphase. Error bars represent SEM from three experiments, P < 0.0001. (Scale bars, 10 μm.)

