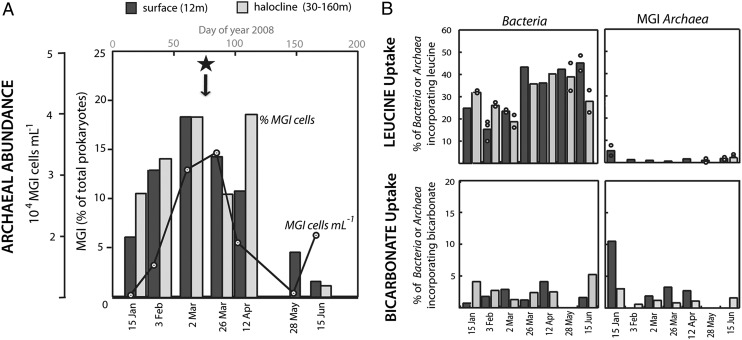
Fig. 1.
Marine Group I (MGI) archaeal in situ abundance and metabolic activity in Arctic waters as analyzed by CARD-FISH and MAR-FISH. (A) Abundance of MGI Archaea expressed as percentage of total prokaryotes (bars) and number of cells in surface waters (line). The star symbol indicates the date at which the Arctic metagenome was retrieved. (B) Single-cell activity of Bacteria and MGI Archaea in the uptake of leucine (Upper) and bicarbonate (Lower). Individual dots represent replicate measurements carried out in some samples. Dark and light gray bars represent samples collected in Arctic surface and halocline waters, respectively.

