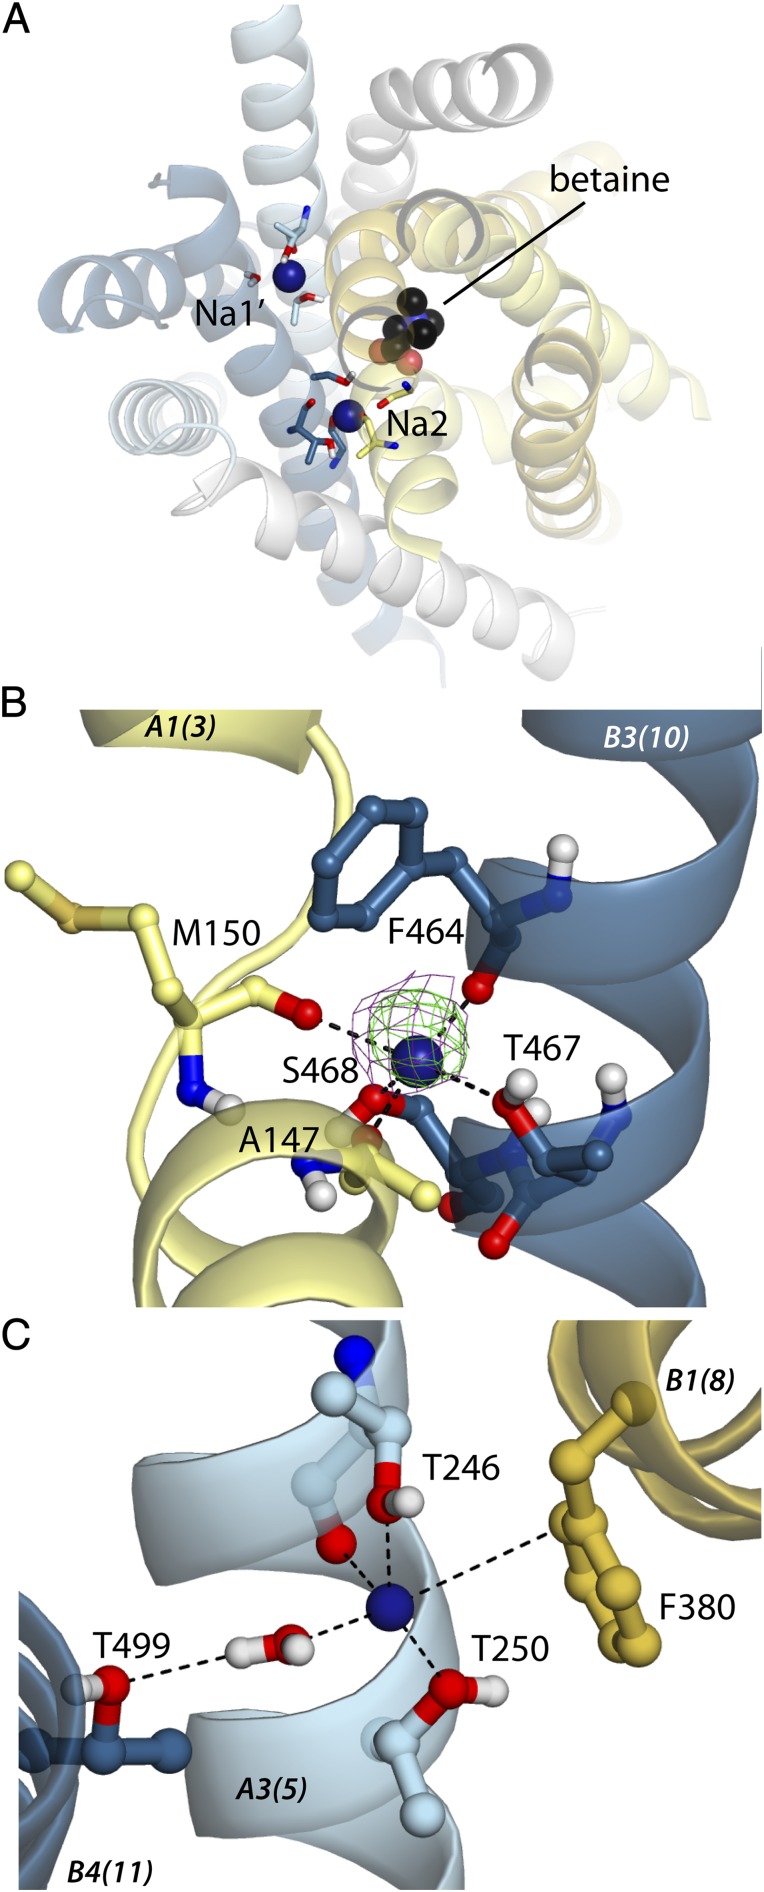
Fig. 3.
Sodium-binding sites in BetP predicted from structural analysis and MD simulations. (A) Simulation snapshot of BetP in a closed state, viewed from the cytoplasm and colored according to Fig. 1. For clarity, only the 10 helices forming the core fold are shown. Bound substrate and sodium ions at Na1′ and Na2 are shown as spheres; coordinating residues and a bound water molecule are shown as sticks. (B and C) Close-up views of simulation snapshots. (B) Simulation snapshot of the Na2 site overlaid with the Fo-Fc difference density map before placing the ion (contoured at 3.0σ, green) and the 2Fo-Fc map (contoured at 1.0σ, purple) for PDB ID 4AIN (7). (C) Simulation snapshot of the Na1′ site. Helices are labeled in italics, according to Fig. S1, with BetP numbering in parentheses.

