Fig. 4.
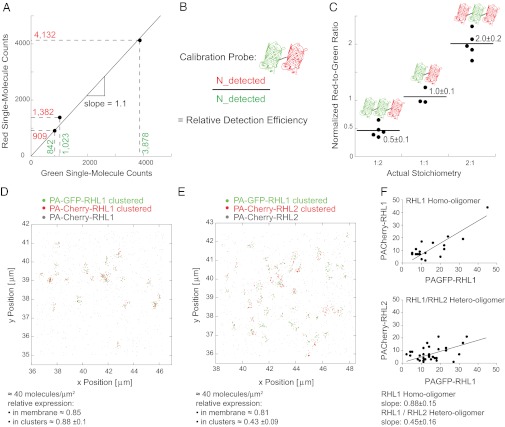
Single-molecule counting PALM visualizes an asymmetric receptor subunit assembly of asialoglycoprotein receptor on the single-molecule level. (A) Single-molecule counting PALM was capable of stably reproducing a specific red-to-green ratio in different cells expressing the vesicular stomatitis virus glycoprotein-PA-GFP-PA-Cherry double construct in different absolute amounts. (B) Strategy for determining the relative detection efficiency of PA-GFP and PA-Cherry using a calibration probe. (C) Applying single-molecule counting PALM to cells expressing vesicular stomatitis virus glycoprotein constructs containing PA-GFP and PA-Cherry in differing amounts permits assessment of the correct stoichiometry of the constructs. Three constructs having the following ratios of PA-Cherry and PA-GFP were assessed: 1 PA-Cherry:2 PA-GFP; 1 PA-Cherry:1 PA-GFP; and 2 PA-Cherry:1 PA-GFP. The red-to-green ratio in each cell expressing the given constructs was determined and normalized to the relative detection efficiency. (D) Coexpression of RHL1 labeled with PA-GFP and PA-Cherry. Applying single-molecule counting PALM, we detected 40 molecules/μm2 and a relative red-to-green ratio of 0.85 in a membrane area of 36 μm2. The relative red-to-green ratio within an RHL1 homo-oligomeric cluster was 0.88 ± 0.1. (E) Coexpression of PA-GFP-RHL1 and PA-Cherry-RHL2. Applying single-molecule counting PALM, we detected 40 molecules/μm2 and a relative red-to-green ratio of 0.81 in a membrane area of 36 μm2. The relative red-to-green ratio of 0.43 ± 0.09 within a hetero-oligomeric cluster, however, deviated significantly from the relative overall expression. RHL1 was more abundant inside the clusters, indicating an asymmetric receptor assembly that approximates a stoichiometry of two RHL1 to every one RHL2 in a cluster. (F) Plotting the detected number of red and green molecules inside the homo- and hetero-oligomeric clusters can be fit to straight lines with a slope of 0.88 ± 0.15 for the RHL1 homo-oligomers as displayed in D and 0.45 ± 0.16 for the RHL1/RHL2 hetero-oligomers as shown in E. The slope of the line fit gives an estimate for the average stoichiometry within a cluster and coincides with the red-to-green ratio within the homo- and hetero-oligomeric clusters, respectively.

