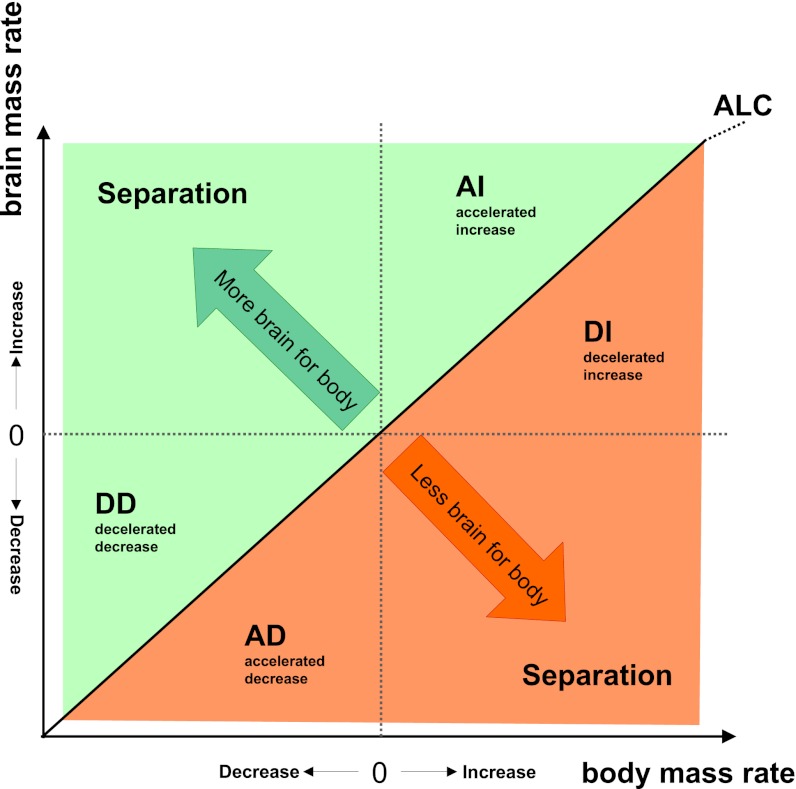
Fig. 2.
Schematic diagram of the relationship of possible evolutionary changes in two traits (body and brain mass). Body and brain mass are measured as rates of change between all ancestor-descendant pairs. Possible scenarios are plotted with respect to the y axis (rate of change in brain mass). The green area indicates increasing relative brain mass, and the orange area indicates relative brain mass reduction. ALC, allometric change. Within each quadrant, a distinction can be made as to which trait (X or Y) increases or decreases more or less than the other, reflecting all possible evolutionary scenarios of change between traits. An important attribute of this approach is that the isometric line represents the allometric relationship between the traits under investigation, independent of the value of the allometric coefficient. Allometric change (ALC), indicates the line along which the quotient of the rates of change remains equal. Deviations from isometry in this figure therefore represent deviations from the allometric relationship between the traits under investigation (Fig. 3). Possible patterns of relative brain size change include that brain and body mass change in: (i) opposing directions (separation); (ii) the same direction but with brain changing faster than body mass (AI and AD); (iii) as (ii) but with body changing faster than brain mass (DI and DD). For closely related traits (e.g., brain and body mass), increased vs. decreased separation mostly occurs on sister branches: When a trait indicates a burst of change in one branch, the sister branch often indicates a smaller opposite trend.

