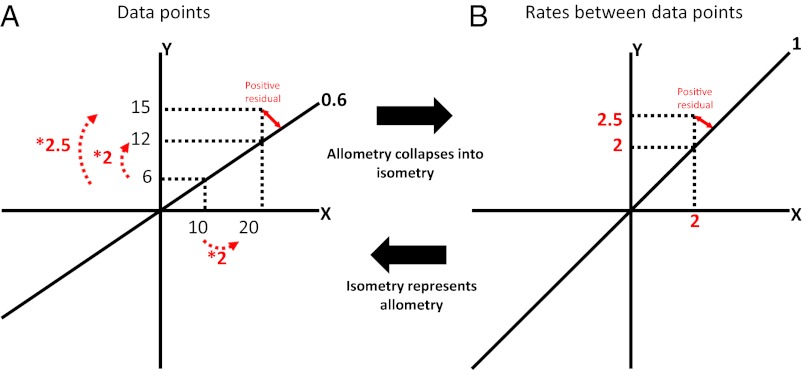
Fig. 3.
Schematic explanation of how the allometric slope of the brain–body relationship collapses into the isometric line when plotting rates of change between data points (B) rather than actual data points (A). Two data points are hypothesized with Y and X values of 6, 10 and 12, 20, respectively, producing an allometric slope of 0.6. Because the allometric slope describes the proportional change from Y to X, plotting rates of change between data points rather than the actual data points results in a collapse of the allometric line into isometry. Equally, positive or negative residuals relative to the allometric line in the “data points plot” (A) are represented as positive or negative (orthogonal) residuals, respectively, relative to the isometric line in the “rates plot” (B). This assumes that the quantification of a rate has the same properties as a proportion (an explanation for how this is true for our model is provided in figure 1 in ref. 25).

