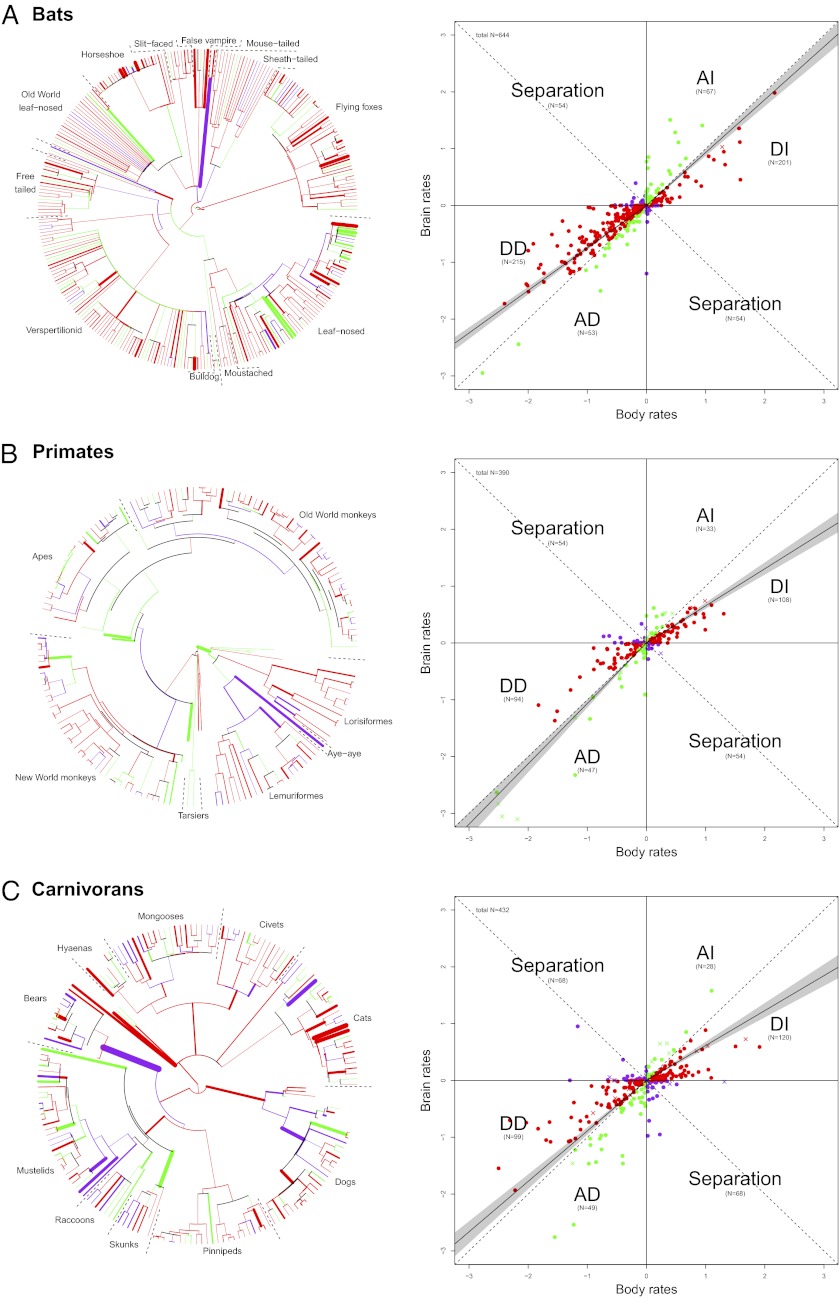
Fig. 4.
Independent reconstruction of brain and body mass according to an AP model. Red data points represent branches where body mass change (increase and decrease) was greater than brain mass change (crosses indicate branches leading to fossils, closed circles indicate branches leading to extant species), corresponding to red branches in the phylogenies. Green data points represent branches with brain mass changes greater than body mass changes, corresponding to green branches in the phylogenies. Purple data points represent branches that indicate separation (increase in body size and decrease in brain size, or vice versa), corresponding to purple branches in the phylogenies. The solid line in the scatter plot indicates the regression line of an RMA correlation forced through the origin based on the branches of the upper right and lower left quadrants separately with the 95% confidence interval of the slopes indicated as the shaded gray area (values presented in Table S2). Numbers in brackets are the number of branches in each category. The thickness of branches in the tree represents the deviation from the isometric line (larger residuals have thicker branches). Bats (including fossils) (A), primates (including fossils) (B), and carnivorans (including fossils) (C) are shown.

