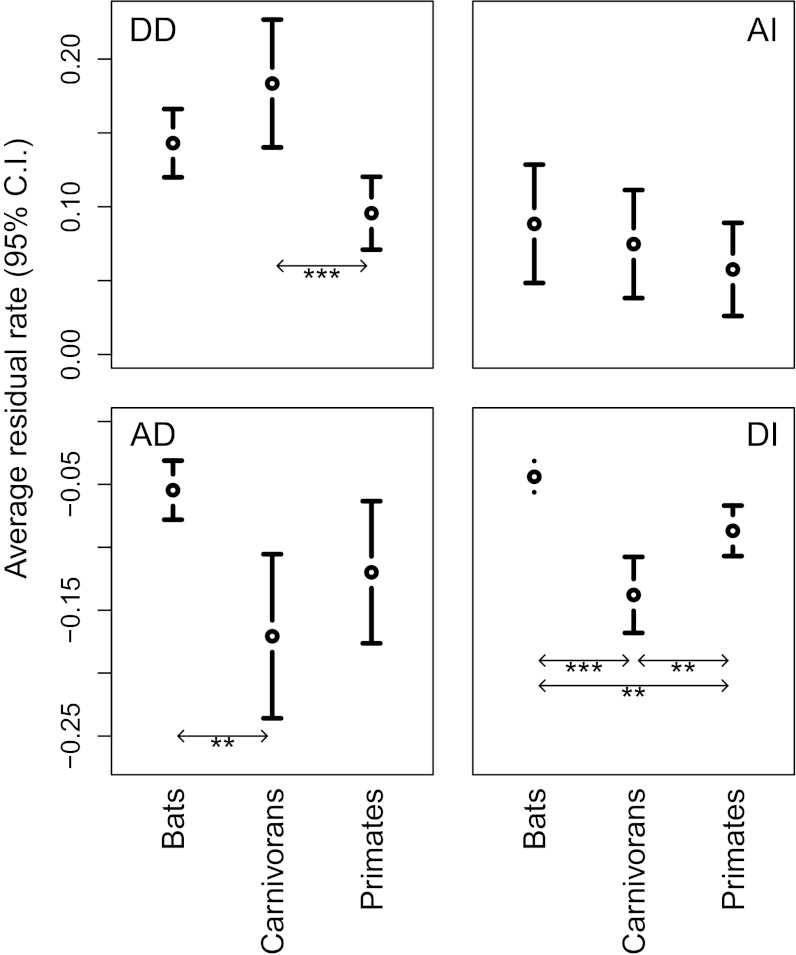
Fig. 5.
Mean and 95% confidence interval (C.I.) of major axis residuals (positive residuals for AI and DD and negative residual values for DI and AD) relative to the isometric line. These values represent the magnitude and variance in the deviation from allometry for each evolutionary scenario (AI, DI, AD, and DD) quantifying “evolvability” (deviations from allometry) in the different mammalian orders. *P < 0.05; **P < 0.01; ***P < 0.001.

