
Figure 2.
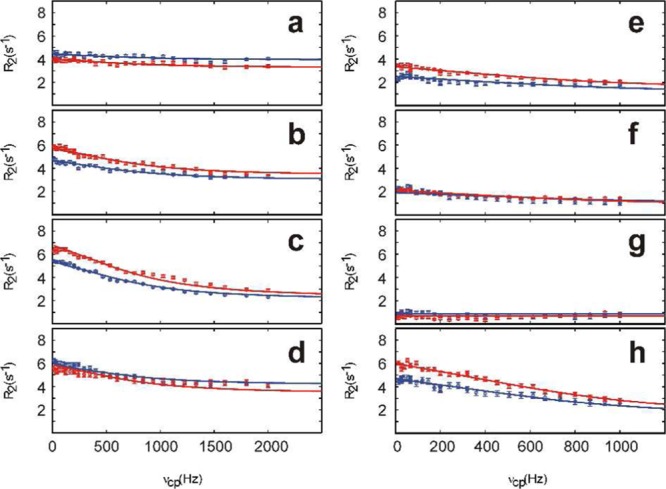
Representative (a–d) 1H and (e–h) 13C methyl CPMG relaxation dispersion profiles acquired on a 1 mM sample of apo-CaM specifically labeled with 12CαH(12CD2)2S13CHD2-Met at static magnetic field strengths of 11.7 T (blue) and 14.1 T (red) and a temperature of 25 °C. The solid lines represent the best simultaneous fits of a global two-state model to the data at both static magnetic fields for each residue, from which the values kex = 4770 ± 147 s–1 and pm = 0.7 ± 0.1% were obtained. The best-fit values of ΔδH were (a) M109, 0.18 ± 0.01 ppm; (b) M124, 0.34 ± 0.01 ppm; (c) M144, 0.48 ± 0.01 ppm; and (d) M145, 0.34 ± 0.01 ppm. The best-fit ΔδC values were (e) M109, 0.84 ± 0.01 ppm; (f) M124, 0.67 ± 0.01 ppm; (g) M144, 0.01 ± 0.01 ppm; and (h) M145, 1.33 ± 0.01 ppm.