Figure 1.

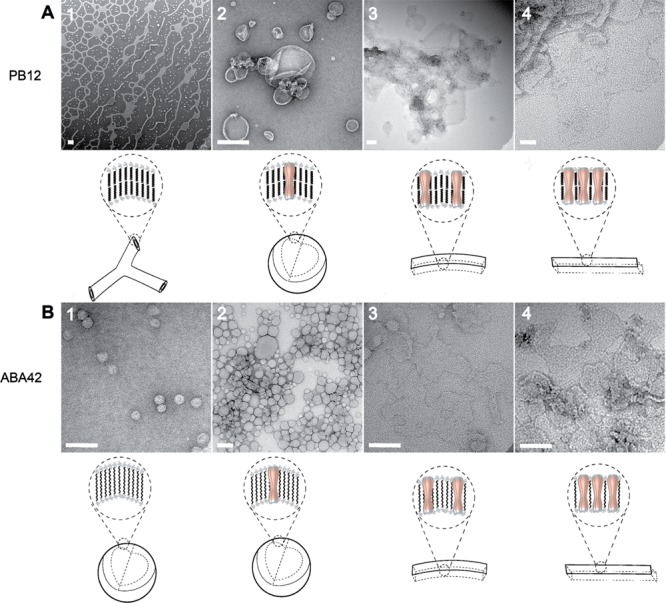
The membrane protein concentration has a large effect on the morphology of the resulting self-assembled membrane protein–block copolymer aggregate. The micrographs show PoPRs that are representative of the range in which a particular aggregate morphology is dominant. (A) Reconstitution of AQP0 with PB12 at molar PoPRs of (1) ∞ (no protein), (2) 15.5, (3) 3.9, and (4) 1.3. The increase in incorporated protein leads to a transition from the network structures formed by pure polymer as described before (ref (27)), to a mixture of network structures and vesicles (shown in Supporting Information Figure S5), to vesicles only, membranes, and finally to crystalline membrane patches. (B) Reconstitution of AQP0 with ABA42 at PoPRs of (1) ∞ (no protein), (2) 43.2, (3) 2.2, and (4) 0.6. The aggregates transition from vesicles only, to larger vesicles, to membranes only, and finally to crystalline membrane patches. Schematics below each panel show the presumed arrangement of polymer bilayers (for PB12) or monolayers (for ABA42) and the location of AQP0 in the formed membranes. Scale bars are 100 nm.
