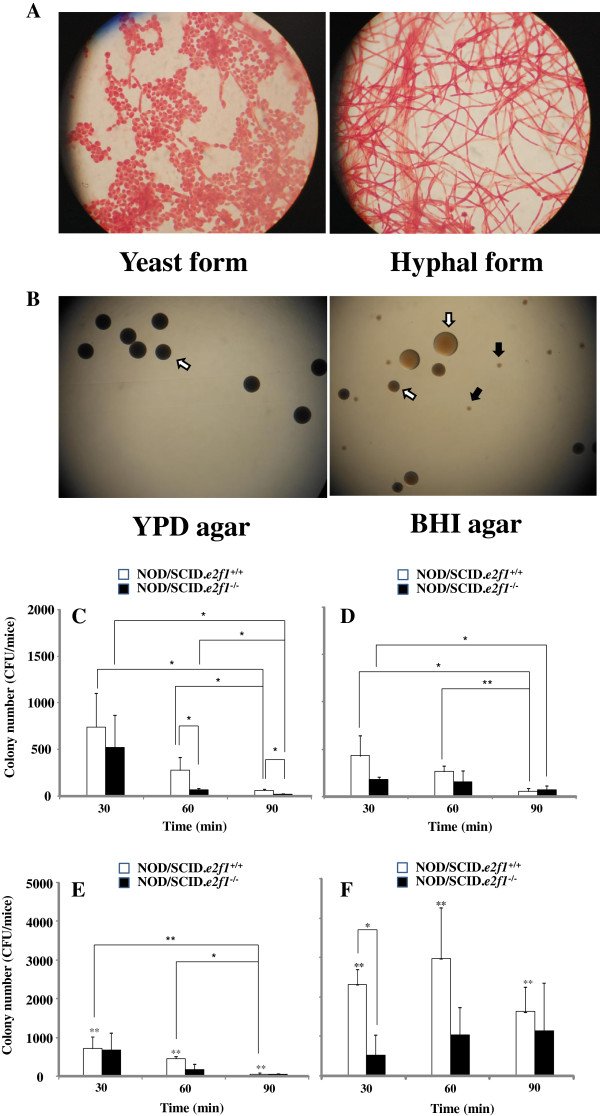
Figure 1.
Observation of C. albicans yeast and hyphal forms, and colony numbers after inoculation. C. albicans yeast and hyphal forms were taken pictures in microscope after incubation of them in YPD and RPMI1640 with 5% FBS (A). The colonization was observed on the YPD agar and BHI agar plates poured swab samples from oral cavity of NOD/SCID.e2f1−/− mice fed 1% sucrose water at 60 min after the inoculation (B). White and black arrow indicated C. albicans and indigenous microorganism colony respectively. These colonies were taken pictures in the stereoscopic microscope. Data were representative in three independent assays. Samples were swabbed from the oral cavities of four 4-month-old female NOD/SCID.e2f1+/+ and NOD/SCID.e2f1−/− mice at 30, 60, and 90 minutes after inoculation using the yeast form. Samples swabbed in mice fed water (C) or 1% sucrose water (D) overnight before inoculation were poured on YPD agar. Samples swabbed in mice fed water (E) or 1% water (F) before inoculation were poured on BHI agar. CFU data were obtained from three independent experiments with four mice from each strain. Values are expressed as the means ± standard deviations (SDs) of the data. Asterisks show significant differences (*P <0.05) in C and D and significant differences (** <0.05) between water (E) and 1% sucrose water (F) for drinking.

