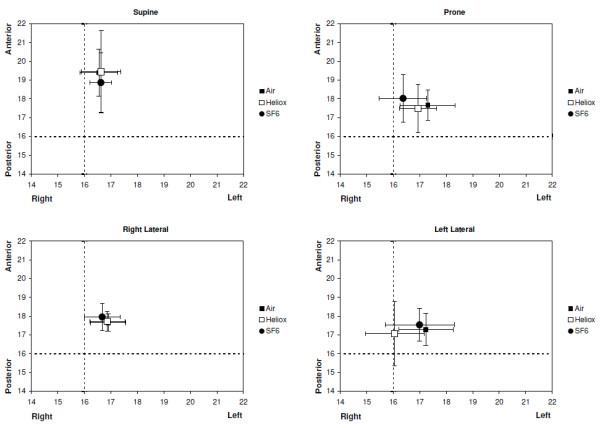
Figure 2.

Geometric centres (mean and 95% confidence interval) for the three gas mixtures in each of four body positions. The position of the GC is located on the EIT image using the 32x32 pixel matrix. The dashed lines indicate the centre of the image.
