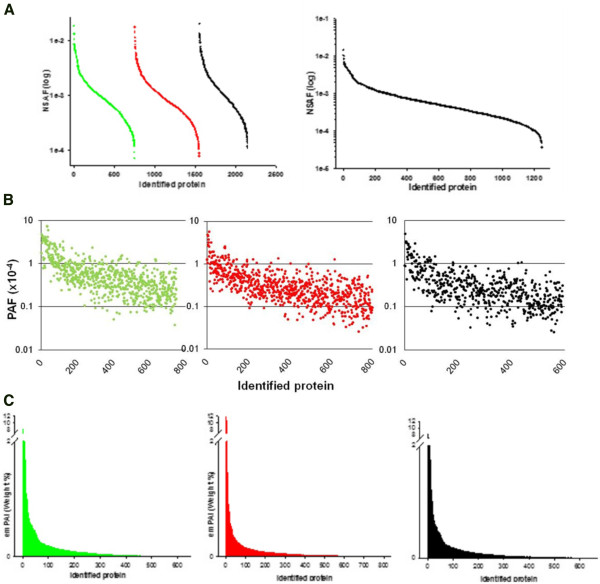
Figure 8.

Relative quantification of murine colon proteins. (A) Normalized spectral abundance factor (NSAF) for each sample (left) and after merging (right). (B) Protein abundance factor (PAF). (C) Protein weight percentage calculated based on exponentially modified protein abundance factor (emPAI).
