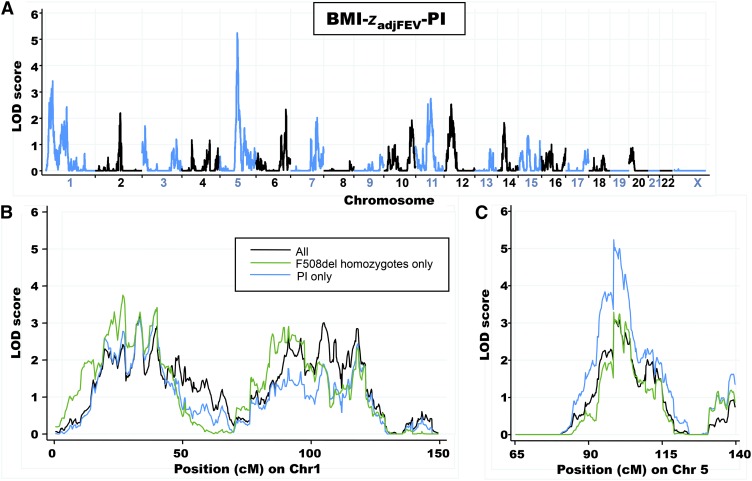
FIGURE 4.
A. Linkage-analysis results for BMI-zadjFEV-PI (350 sibling pairs). Alternating blue and black lines represent Chrs labeled on the x axis, and the strength of linkage is indicated by the LOD score on the y axis. B: Comparison of Chr 1 linkage results for BMI-zadjFEV-PI, BMI-zadjFEV-F508del, (213 sibling pairs), and BMI-zadjFEV (393 sibling pairs). C: Comparison of Chr 5 linkage results for each phenotype. Linkage analysis was performed with each residual phenotype by using the variance-components algorithm as implemented in the MERLIN 1.1.2 software program (34). BMI-zadjFEV, average BMI z score from 5 to 10 y of age adjusted as for BMI-zadj plus for FEVq6to10; BMI-zadjFEV-F508del, BMI-zadjFEV values with the inclusion of only subjects homozygous for F508del; BMI-zadjFEV-PI, BMI-zadjFEV values with the inclusion of only pancreatic-insufficient subjects; Chr, chromosome; LOD, log of odds; PI, pancreatic insufficiency.

