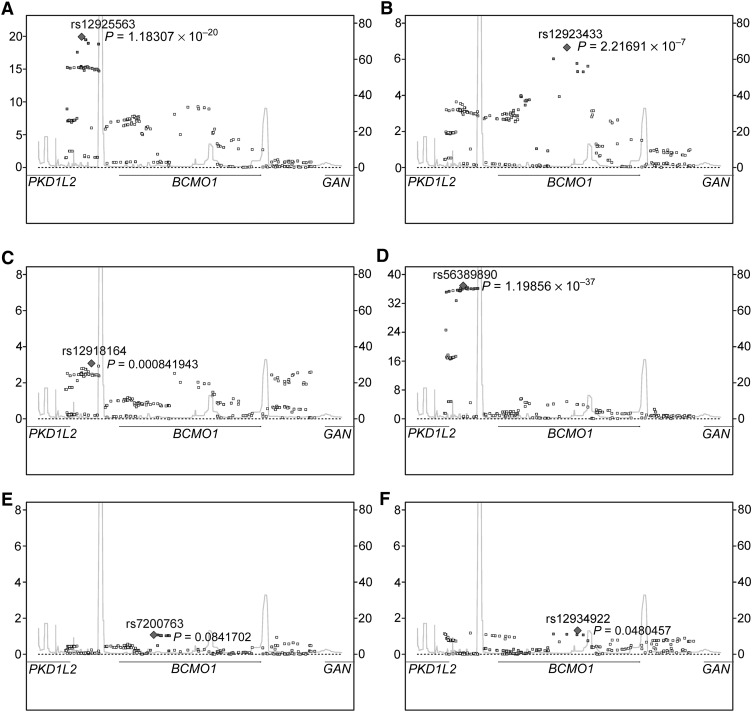
FIGURE 1.
Regional (NCBI 36 chr16:79829797–79882248) association plots between SNPs in BCMO1 ± 20 kb and plasma carotenoid and retinol concentrations among women with genome-wide scans (n = 2323–2340). Plotted P values are from multivariate linear regression of each natural log–transformed plasma biomarker concentration on additively modeled SNPs adjusted for the following covariates: age, case-control status, cholesterol (mg/dL or missing indicator), BMI (kg/m2), smoking (never/former, current <15 cigarettes/d, current ≥15 cigarettes/d), menopausal status and PMH use (premenopausal; postmenopausal, no PMH; postmenopausal, PMH; unknown), alcohol intake (g/d), total fat intake (g/d), and dietary intake of the outcome of interest (μg/d for carotenoids or IU/d for retinol). Dietary retinol intake (IU/d) was also included in the models for α-carotene, β-carotene, and β-cryptoxanthin. A: β-carotene; B, α-carotene; C, β-cryptoxanthin; D, lutein/zeaxanthin; E, lycopene; F, retinol. Left y axis = observed (-logP); right y axis = recombination rate (centiMorgans/megabase); x axis = chromosome 16 position (human genome 18) (kb). chr, chromosome; NCBI, National Center for Biotechnology Information; PMH, postmenopausal hormone; SNPs, single nucleotide polymorphisms.

