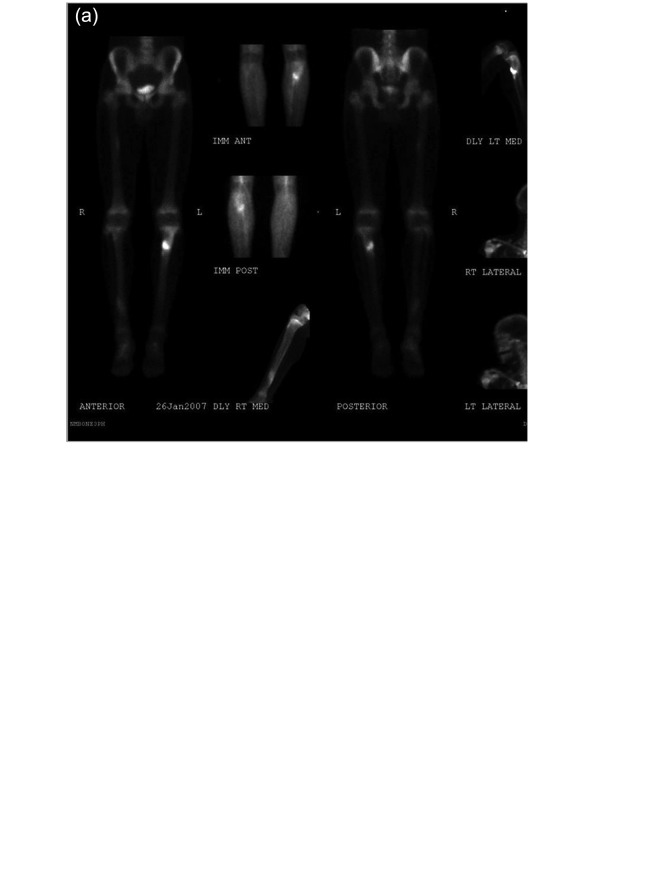
Figure 3.
(a) Bone scan demonstrates increased tracer uptake in the proximal tibia in both immediate and delayed phase images consistent with a proximal tibial stress fracture. (b) and (c) Magnetic resonance imaging clearly shows a distal tibial stress fracture line on both T1 and T2 weighted images.

