
Fig. 19.
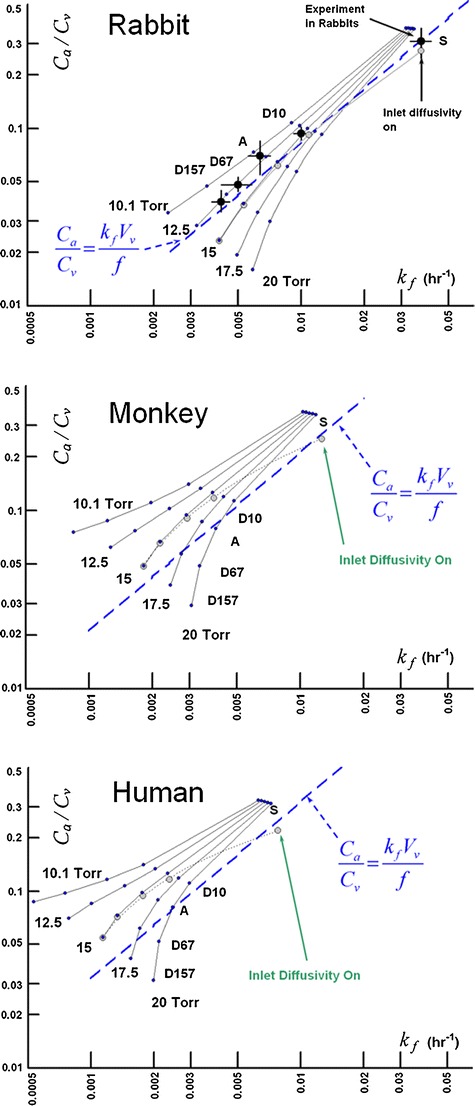
Influence of intraocular pressure on clearance after IVT injection in the three species model including all tissues. Inlet diffusivity was disabled except for the case of 15 Torr, for which the simulations were repeated with inlet diffusivity enabled. Blue trend lines were calculated from Eq. 9 using the vitreous volume and aqueous flow rate for each species model listed in Table II.