
Figure 1.
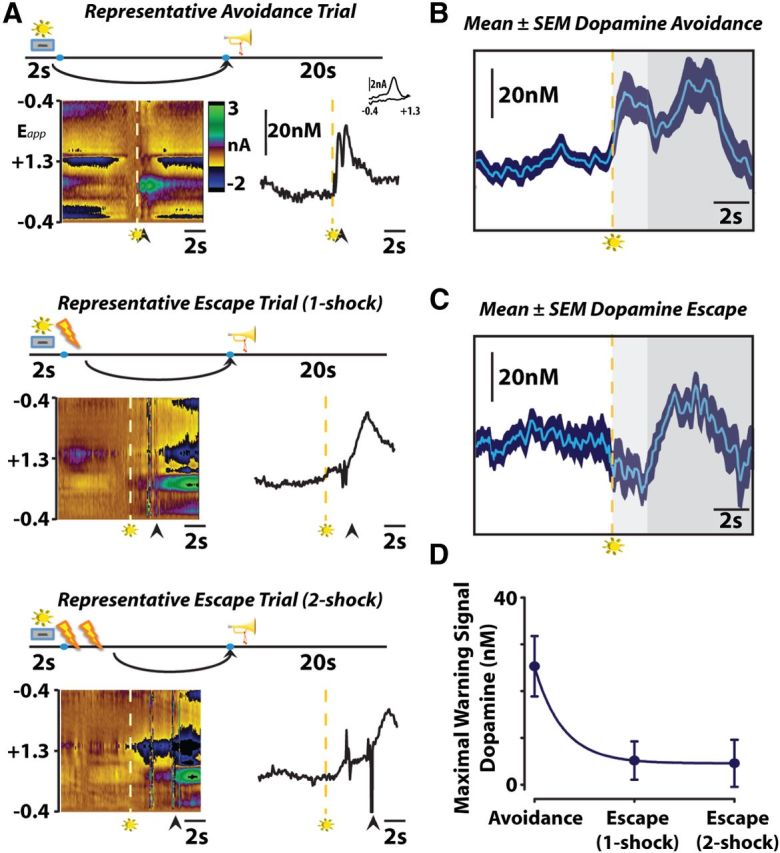
A, Dopamine encodes conditioned stimuli during negative reinforcement. Representative color plots (left) and dopamine concentration traces (right) show avoidance (top), one-footshock escape (middle), and two-footshock escape (bottom) responses. Arrows indicate lever responses, lightning bolts indicate footshocks, trumpets indicate safety periods, levers+lights indicate warning signals. Left, Voltammetric current (z-axis) plotted against applied scan potential (Eapp; y-axis) and time (x-axis). Right, Dopamine concentration traces plotted as a function of time. Inset shows cyclic voltammogram for dopamine. B, Warning signal presentation increases dopamine release when rats successfully avoid footshock. Mean (n = 9) ± SEM traces depict the time course of changes in subsecond dopamine release as animals minimize punishment by avoiding footshock. Dashed lines represent warning stimulus onset, around which mean data are grouped. Color representations: light gray, maximum warning stimulus duration; dark gray, safety period. C, Warning signal presentation inhibits dopamine release when rats fail to avoid or escape footshock. Only one-footshock escape trials are included in the mean (n = 9). D, Maximal dopamine concentration evoked by warning signal presentation predicts successful punishment avoidance.