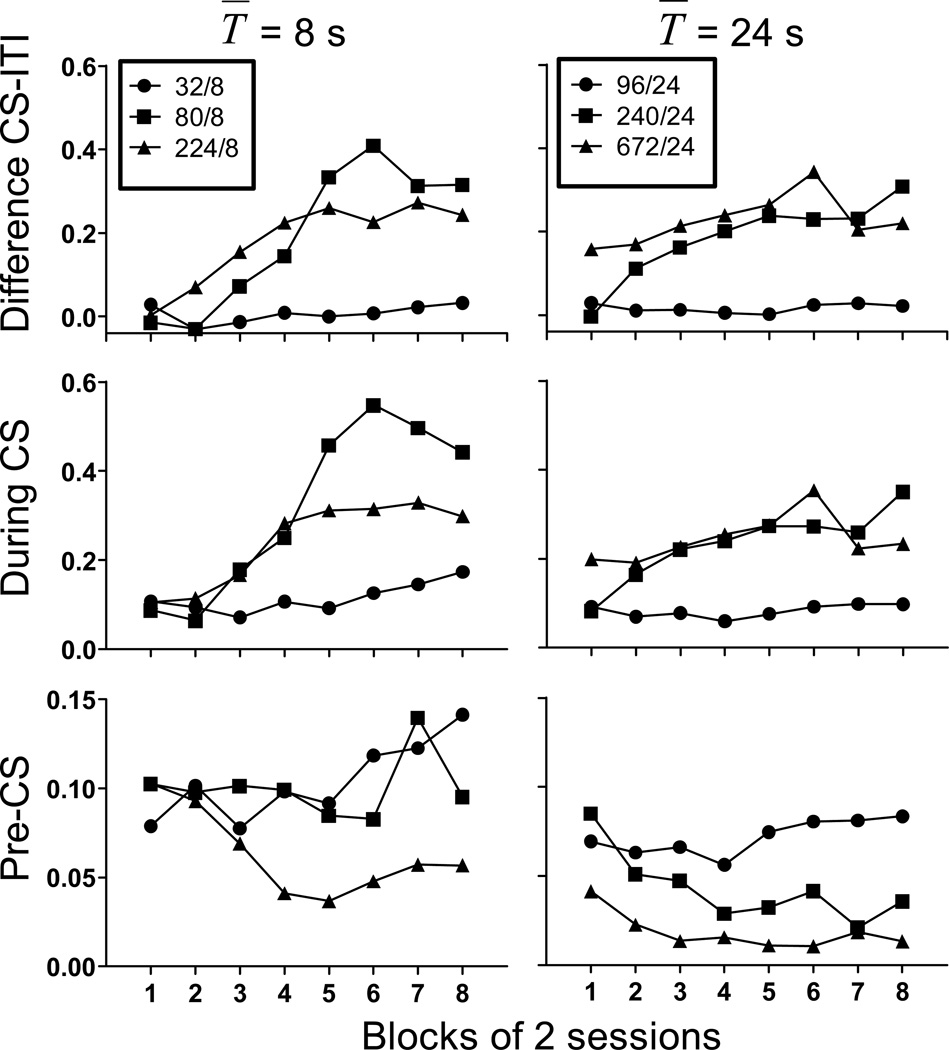
Figure 1.
The difference in responses per second during the ITI and CS (top row), response rate during the CS (middle row), and response rate during the pre-CS period (bottom row) as a function of blocks of training sessions for all groups of subjects in all conditions of Experiment 1. Groups with T̅ =8 s are shown in the left panels, while groups with T̅ =24 s are shown in the right panels. Note the different scales of the y-axes.

