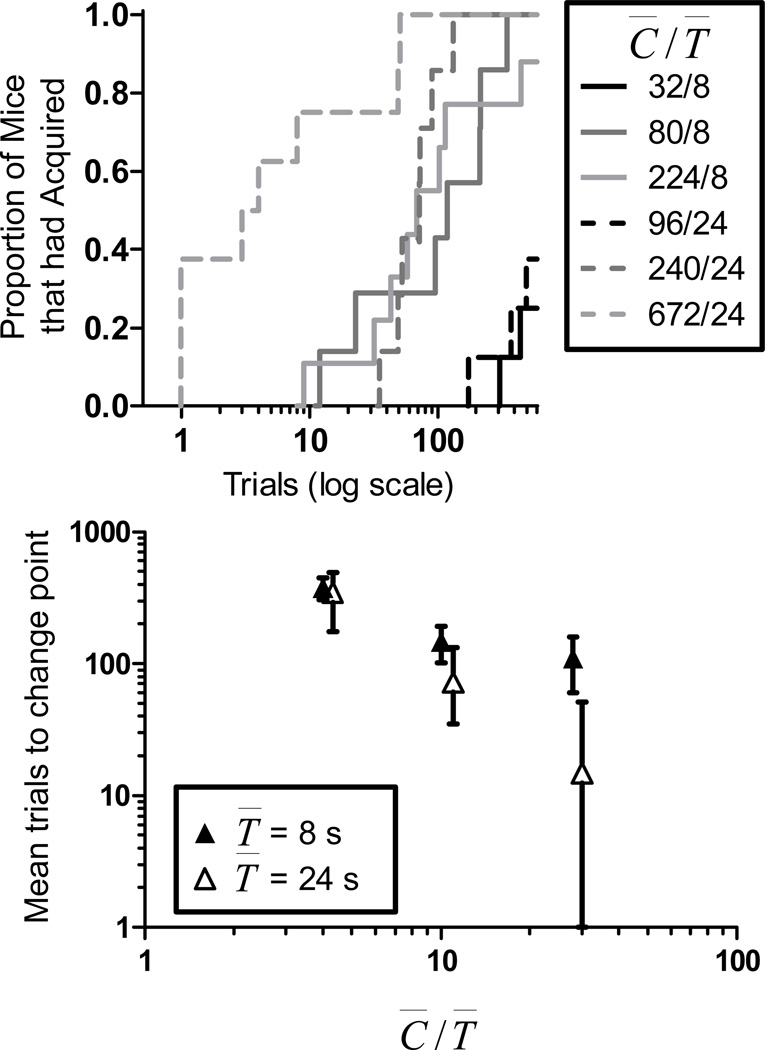
Figure 5.
The left panel shows cumulative acquisition distributions showing the proportion of mice that had acquired (for whom a change point had been determined) as a function of trials (CS-US pairings) for all groups in Experiment 1. See text for details. The right panel shows mean trials to change point as a function of C̅/T̅ ratio for all groups in Experiment 1. Error bars show the standard error of the mean.

