
FIGURE 3.
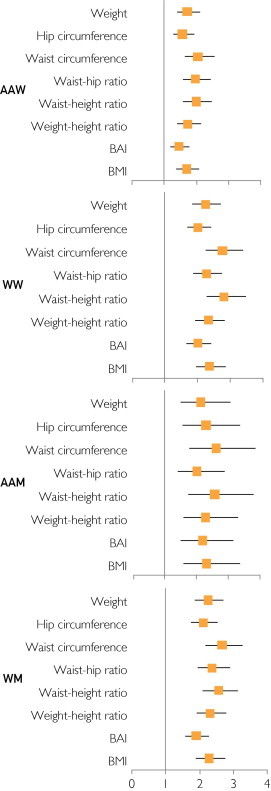
Results of logistic regression analyses predicting 2 or more elevated cardiovascular disease risk factors from anthropometric measurements. The effect size is represented by an odds ratio and corresponding 95% confidence interval. AAM = African American men; AAW = African American women; BAI = body adiposity index; BMI = body mass index; WM = white men; WW = white women.