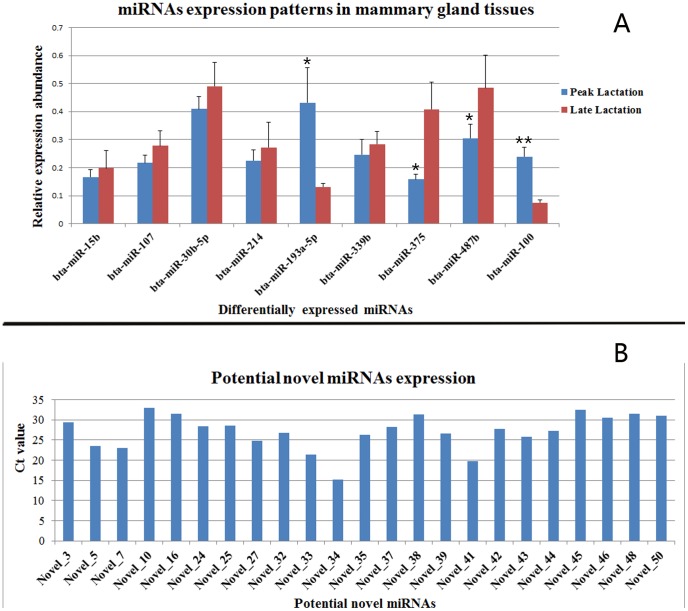
Figure 4. qRT-PCR validation of the identified miRNAs using Solexa sequencing technology.
A: Real-time RT-PCR results for 9 known miRNAs in peak and late lactation. The relative quantification of expression was calculated using the 2−△△CT method after the threshold cycle (Ct) and was normalized with the Ct of U6. The relative expression levels were presented as the 2−△△Ct means ± SE. The error bars indicate the standard error of the 2−△△Ct mean values. * represents p<0.05, ** represents p<0.01. B: Potential novel miRNAs expression in mammary gland. Total RNA pooled from five individuals of two lactation periods were used for qRT-PCR, the relative expression abundance were expressed as Ct value, each sample was replicated for three times.

