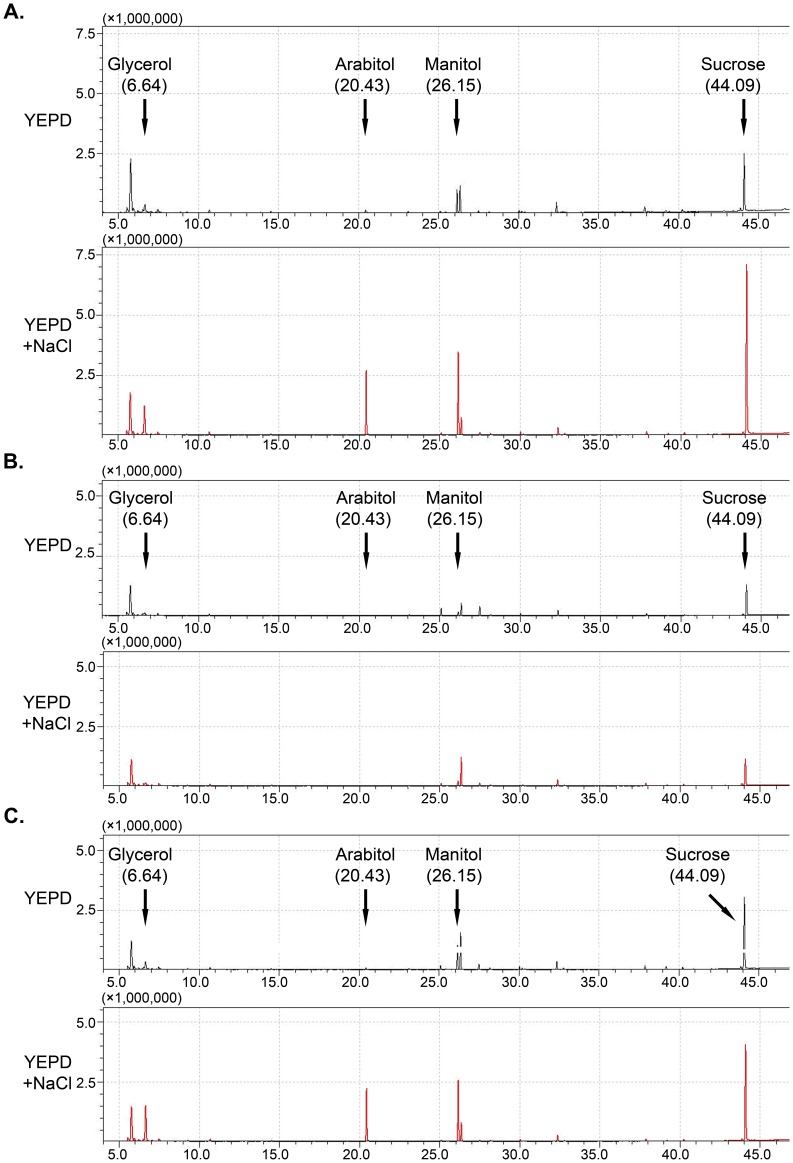
Figure 9.
Metabolic profiles of the wild type PH-1 (A), Fghog1 mutant (B), and the Fghog1/FgHOG1 complemented transformant (C) cultured in YEPD with or without 1 M NaCl. The X-axis is the retention time (RT) in minutes. The Y-axis represents the abundance of total ion current. The peaks with RT of 6.64, 20.43, 26.15, and 44.09 are glycerol, arabitol, mannitol, and sucrose, respectively. The far left peak (RT = 5.75) is 1,2,2,3,4,5-hexamethyl-1,2,5-azasilaborole.

