
Figure 3. Amino acid positions identified in each HAD signature.
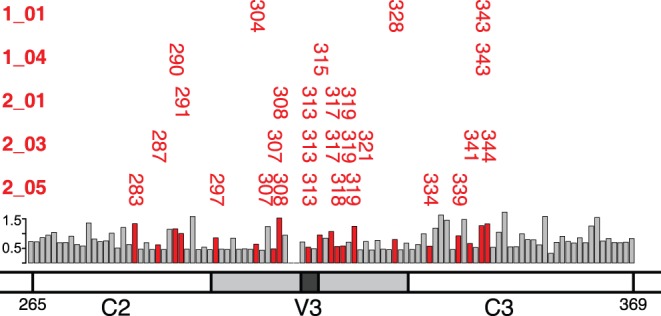
Amino acid positions are plotted for each HAD signature against a schematic of the HIV C2-V3-C3 region examined. Shannon entropy values of all positions in the alignment are plotted as a bar graph, with colored bars marking positions included in HAD signatures.