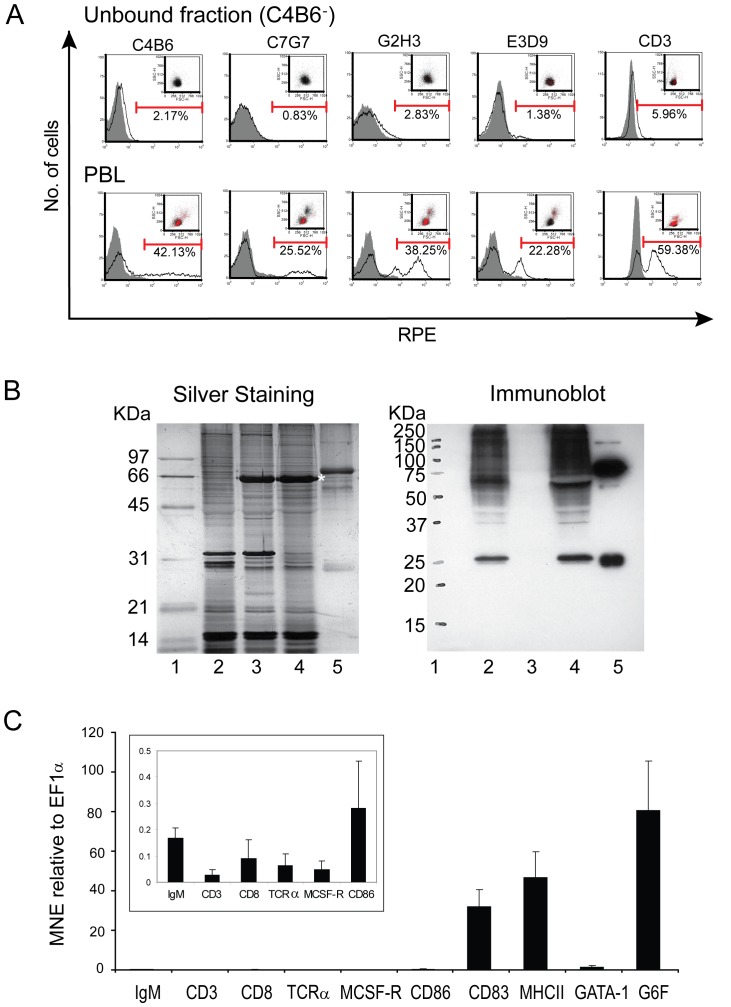
Figure 2. The C4B6− cells are negative for lymphocyte-, neutrophil and monocyte/macrophage markers, but express CD83 and MHC class II.
(A) Flow cytometry analyses of the unbound fraction after MACS show the C4B6− cells' reactivity with MAb C4B6 (anti-leukocytes), C7G7 and G2H3 (B-cells), E3D9 (neutrophils) and the polyclonal anti-human CD3 antiserum (T- and IgM+ cells). Representative histograms are shown. Grey filled curves are negative controls. Positive cells are shown as red dots. The markers represent positive cells. The antibodies reactivity against PBL prior to MACS is shown in the lowest panels. (B) A silver stained SDS- polyacrylamide gel, left panel, and an immunoblot using polyclonal IgM serum developed with ECL, right panel. Lane 1, molecular mass markers; lane 2, PBL; lane 3, unbound fraction after MACS (C4B6− cells); lane 4, bound fraction after MACS (C4B6+ cells); lane 5, salmon IgM. The 66 KDa band (*) in lane 3 and 4 is most likely BSA present in the MACS buffer. (C) qRT-PCR analysis of the C4B6− cells. Gene expression of the following genes; IgM (B-cell marker), CD3, CD8 and TCRα (T-cell markers), MCSF-R (monocyte/macrophage marker), CD86 (involved in antigen presentation), CD83 (DC marker), MHC class II (APC), GATA-1 and G6F (thrombocyte/erythrocyte markers) is presented as mean normalized expression (MNE) using EF1α as reference gene (n = 4). The average of triplicates from four fish with standard error is shown. Note different scale in the inserted histogram.

