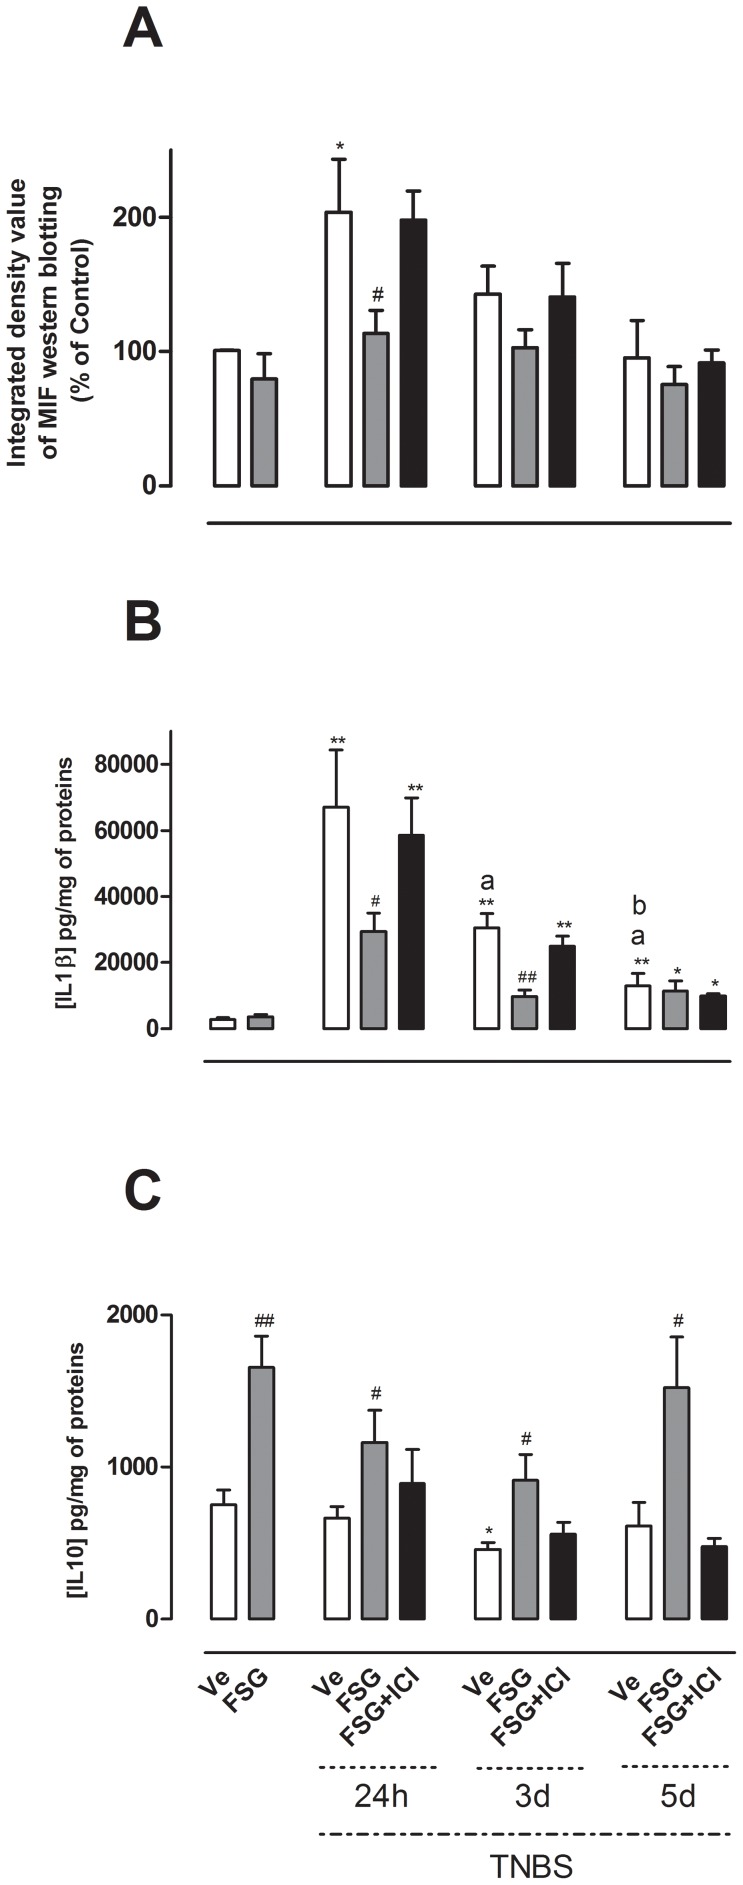
Figure 2. Effects of FSG treatment on cytokine profile after TNBS colitis.
Effects of FSG on (A) MIF expression, (B) IL-1β, (C) IL-10 levels were evaluated in non inflamed colon and 24 h, 3 d, 5 d after TNBS-induced colitis in presence or absence of the ER antagonist ICI 182.780. Values are presented as means ± SEM. Statistical analysis were performed by One way-ANOVA with post hoc comparison by Tukey test. *p<0.05 vs non inflamed group, **p<0.01 vs non inflamed group, #p<0.05 vs inflamed vehicle, ##p<0.01 vs inflamed vehicle, ap<0.05 vs Ve-treated rats 24 h post-TNBS, bp<0.05 vs Ve-treated rats 3 d post-TNBS.

