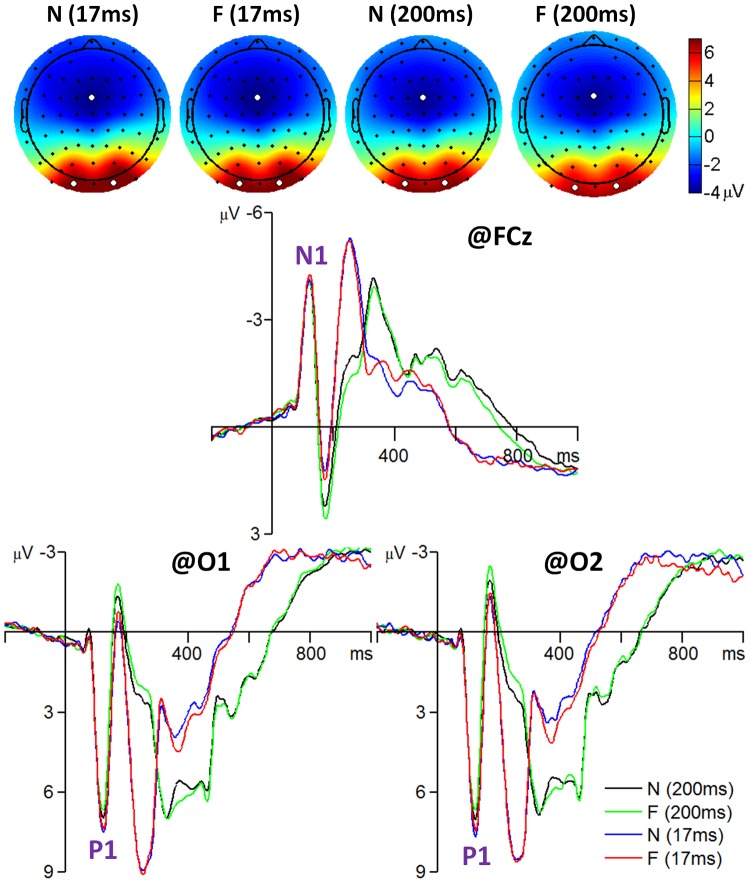
Figure 2. The grand-mean ERPs of all 42 subjects for the frontal N1 and occipital P1 components.
The scalp topographies were computed at the time interval of 115 to 135 ms. The three white dots in each topography indicate which three electrodes recorded the most prominent electrical activity. F, fearful faces; N, neutral faces.

