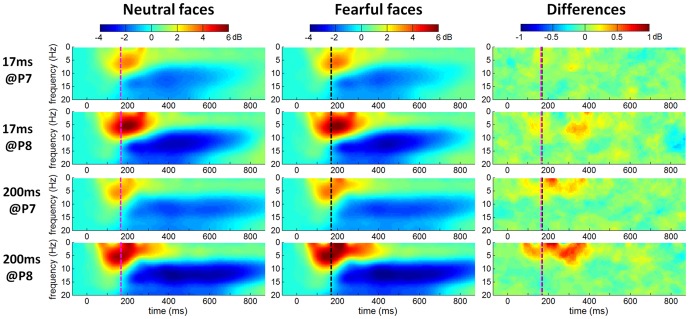
Figure 5. The grand-mean ERSPs of all 42 subjects at P7 and P8 electrodes.
Single-participant ERSP was computed for neutral, fearful and fearful-neutral conditions, averaged across 42 subjects. Nongreen areas in the time/frequency plane show significant (p<.05) post-stimulus increases (red) or decreases (blue) in log spectral power relative to mean log power the 200-ms pre-stimulus baseline. Vertical dotted lines indicate the N170 latency in response to neutral (magenta line) and fearful faces (black line).

