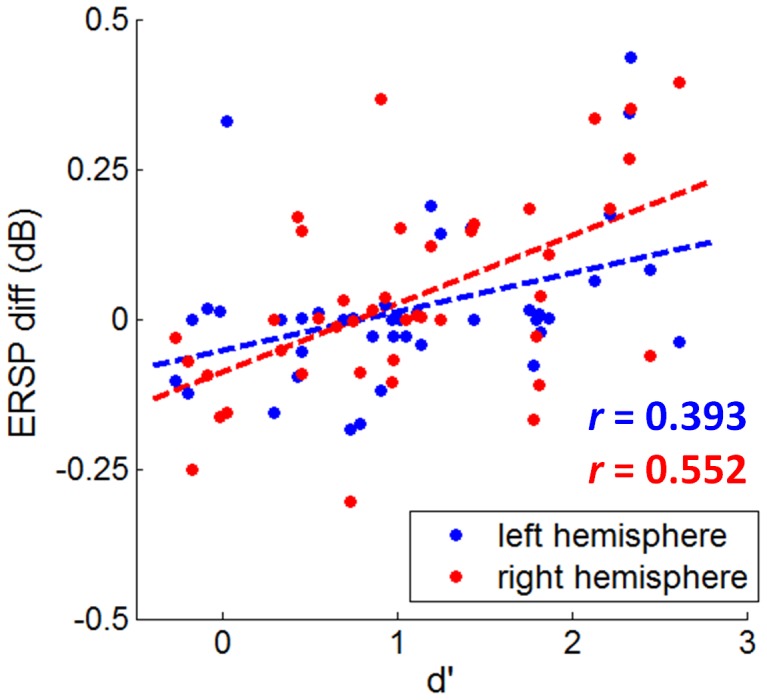
Figure 6. The scatter plots between the behavioral measure d' and the ERSP differences (fearful ERSP – neutral ERSP) at P7 and P8 electrodes in response to 17-ms presentation.

Significant linear correlation is indicated by dashed line in associated color.
