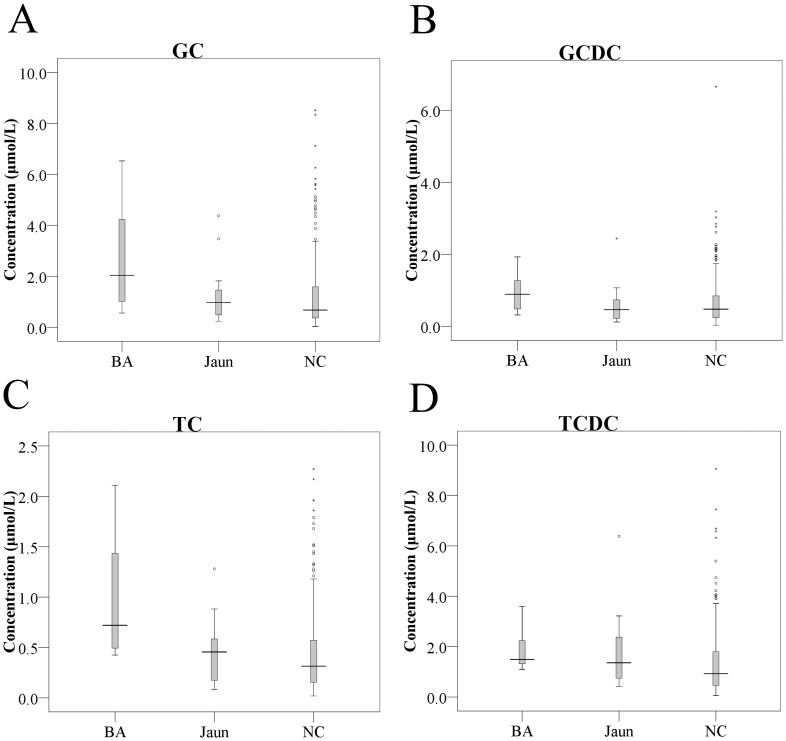
Figure 1. Boxplots of GC (A), GCDC (B), TC (C) and TCDC (D) in dried blood spots of biliary atresia (n = 8), neonatal jaundice (n = 17) and comparison infants (n = 292).
The concentrations of GC, GCDC, TC, and TCDC in BA were significantly higher than those of comparison infants (p<0.05). TC was also significantly elevated in BA compared to neonatal jaundice. No significant difference was observed between neonatal jaundice and comparison infants. BA: biliary atresia infants, Jaun: neonatal jaundice infants, NC: comparison infants.

