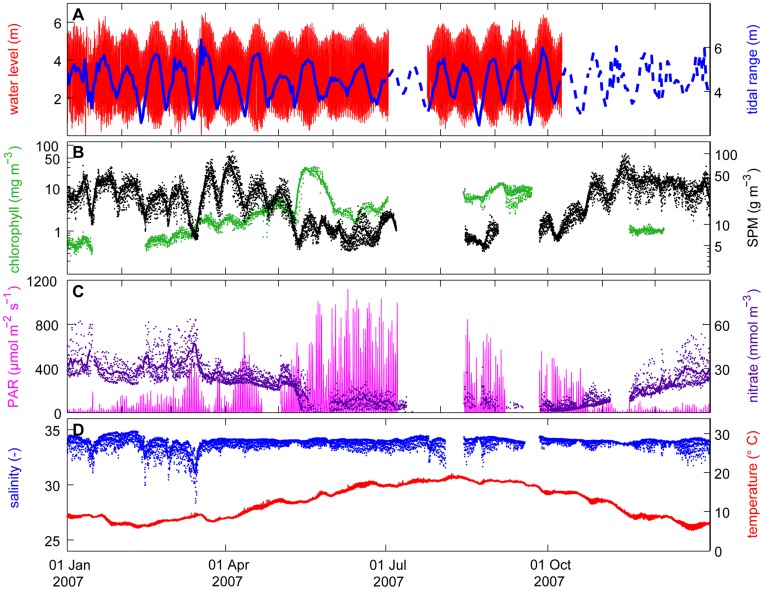
Figure 2. Time series measured in 2007.
(A) Water level (red line) and tidal range (blue solid line) at station Sheerness. When tidal data at station Sheerness were missing, we show the tidal range at station K13A (blue dashed line) rescaled to match the tidal range at Sheerness. (B) Chlorophyll concentration (green) and SPM concentration (black). (C) Nitrate concentration (dark purple) and light intensity at 1 m depth (pink). (D) Salinity (blue) and water temperature (red). In (B-D), dots show the hourly averages and lines the daily averages.

