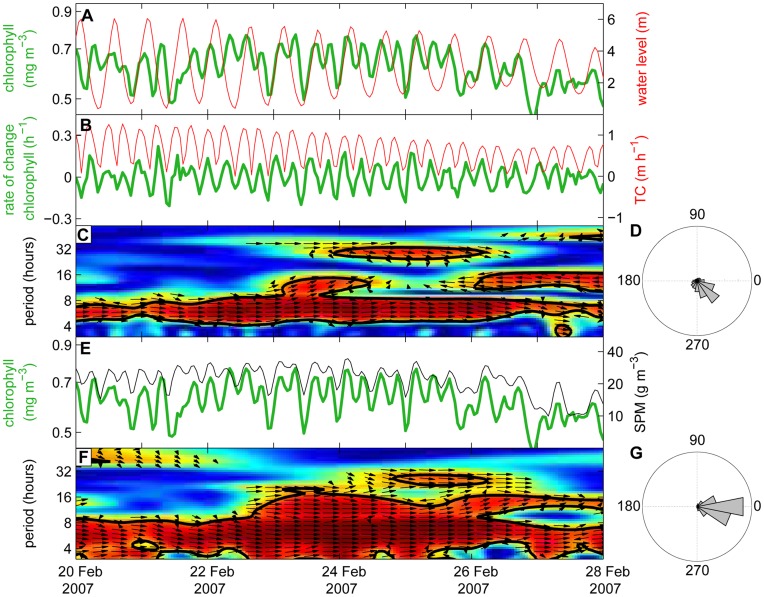
Figure 5. Coherence between fluctuations in chlorophyll, tidal current speed and SPM on an hourly time scale.
(A) Time series of hourly averaged chlorophyll concentration (green line) and water level (red line) during 8 days in winter 2007. (B) Time series of the rate of change in chlorophyll concentration (green line) and the estimated tidal current speed (TC, red line). (C) Wavelet coherence spectrum of the two time series in panel B. Color coding indicates the coherence of the two time series. Arrows indicate the phase angle between fluctuations of the two time series, with arrows pointing to the right representing in-phase fluctuations. See the legend of Fig. 3 for further explanation of wavelet spectra. (D) Relative distribution of phase angles between fluctuations in the rate of change in chlorophyll concentration and fluctuations in tidal current speed. (E) Time series of hourly averaged chlorophyll concentration (green line) and SPM concentration (black line). (F) Wavelet coherence spectrum of the two time series in panel E. (G) Relative distribution of phase angles between fluctuations in chlorophyll concentration and SPM concentration. The phase angle distributions in (D) and (G) are based on the complete time series (2001–2009).

