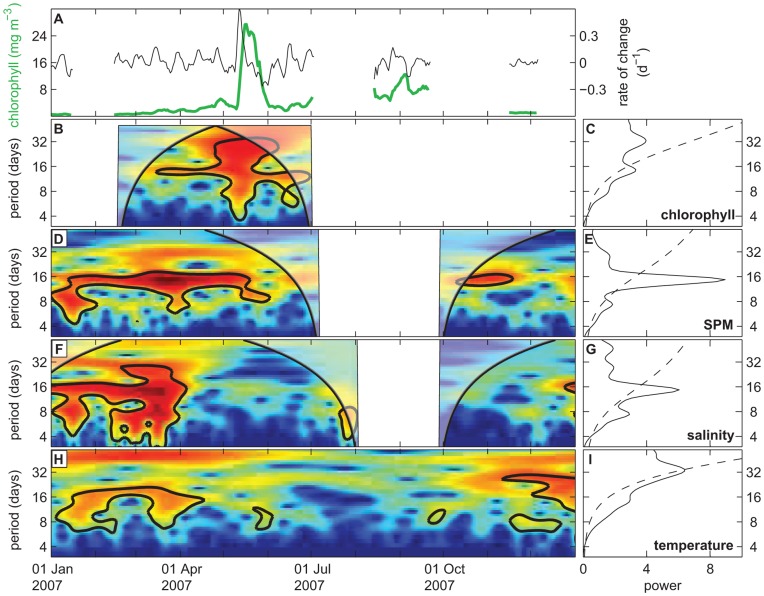
Figure 6. Wavelet analysis of chlorophyll, SPM, salinity and temperature on a daily time scale.
(A) Original time series (green line) and transformed time series (rate of change, black line) of daily averaged chlorophyll concentration in the year 2007. (B-I) Wavelet power spectra (left panels) and global wavelet spectra (right panels) of daily averaged data of (B, C) chlorophyll concentration, (D, E) SPM concentration, (F, G) salinity, and (H, I) temperature. The wavelet power spectra show only the year 2007; the global wavelet spectra are based on the complete time series (2001–2009). See the legend of Fig. 3 for an explanation of wavelet power spectra.

