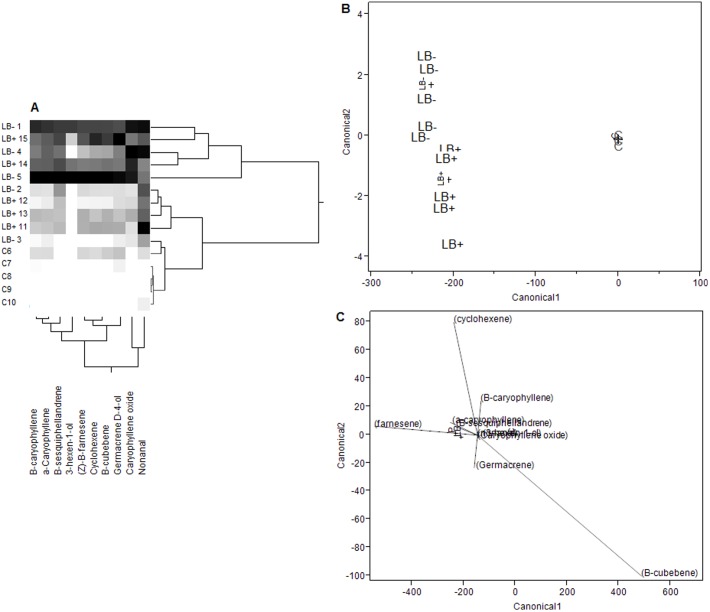
Figure 1. Analysis of volatile emissions from S. tuberosum.
(A) Cluster analysis of the abundances (total ion chromatograms) of ten compounds in the headspace of undamaged control (C) and experimentally challenged (LB+, LB−) potato plants. Grayscale gradations show an increasing abundance of compounds from low to high (white to black, respectively). (B) A discriminant function analysis (DFA) plotting canonical scores of log corrected values of the ten compounds shown in cluster analysis. Individual plants are indicated by lettering (LB−, LB+, C) and crosses denote centroid values. (C) Biplot rays indicating the relative importance of each compound (shown by ray length) in the ordination. Note that the canonical variable scale differs from (B) to (C).

