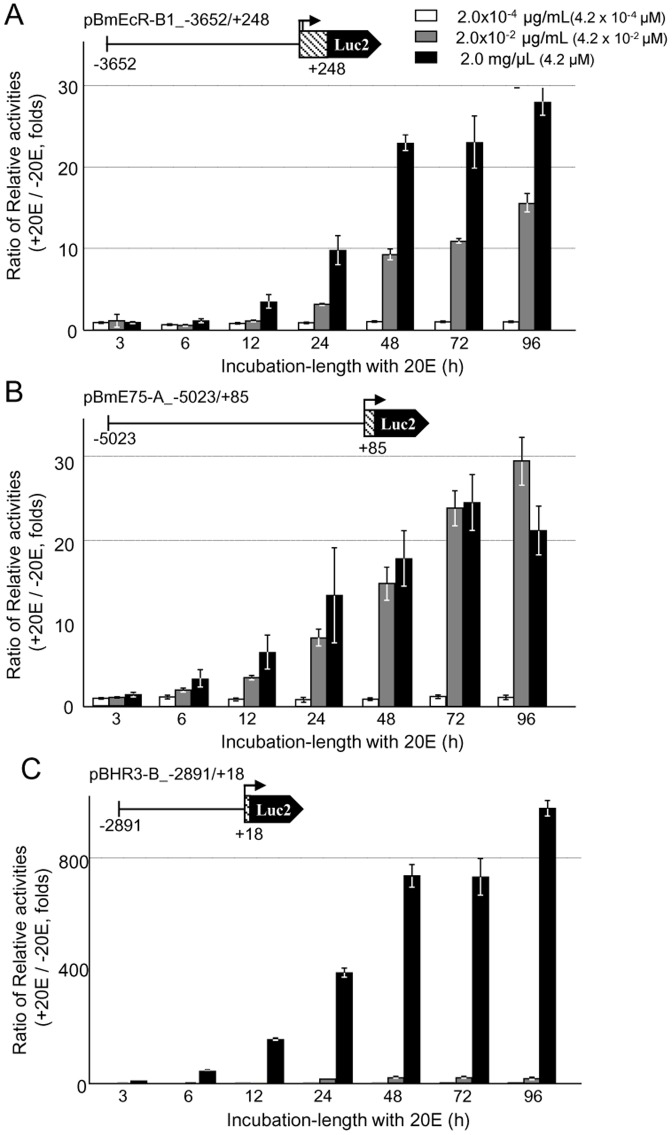
Figure 2. Dose response to 20E of each promoter region for three nuclear receptor genes.
Each promoter activity for the full length plasmid of BmEcR-B1 (A, pBmEcR-B1_−3652/+248), BmE75-A (B, pBmE75-A_−5023/+85), and BHR3-B (C, pBHR3-B_−2891/+18)) under 2.0×10⁻⁴(white bar), 2.0×10⁻² (grey bar) and 2.0 µg/mL (filled bar) of 20E in aff3 cells is shown at each incubation time (h). The ratio of relative luciferase activities with and without 20E (fold induction by 20E) is shown (reference 1.0 at 96 h without 20E). Error bars represent standard error (SE) (N = 4).

