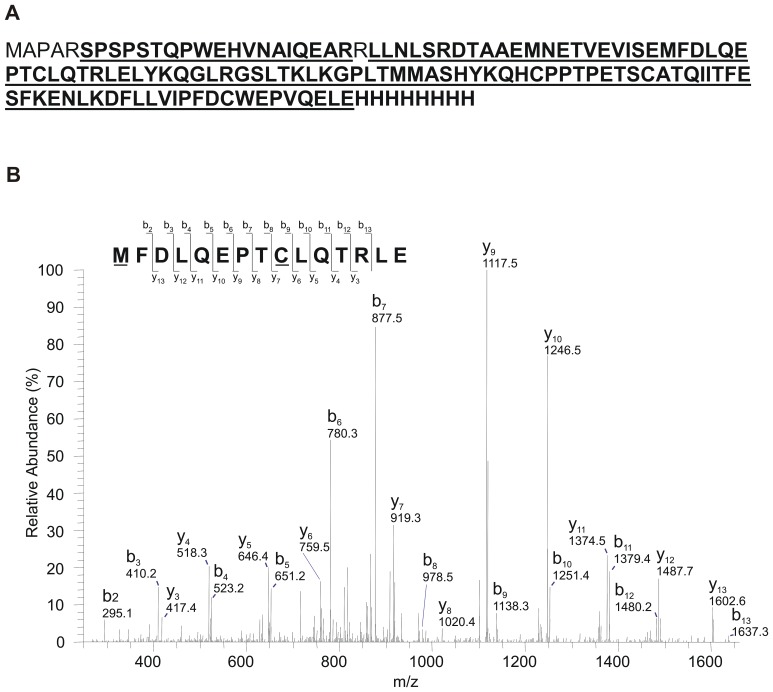
Figure 3. Mass spectral analysis of purified rhGM-CSF.
(A) Shown is the sequence of the expressed rhGM-CSF. In bold and underlined is rhGM-CSF sequence coverage obtained by the mass spectral analysis. 95% sequence coverage was obtained, not including the 8×His tag. The rhGM-CSF was cleaved separately by trypsin and Protease V8 and the generated peptides likewise analyzed separately by LC-MS/MS (FT-ICR). (B) The MS/MS spectrum of the doubly charged peptide MFDLQEPTCLQTRLE (m/z 948.95), which is the fragment of protein granulocyte-macrophage colony-stimulating factor (amino acid residues 63–77) digested by protease V8, is shown as a representative spectra. M: Methionine oxidation; C: Cystine carbamidomethyl modification.

