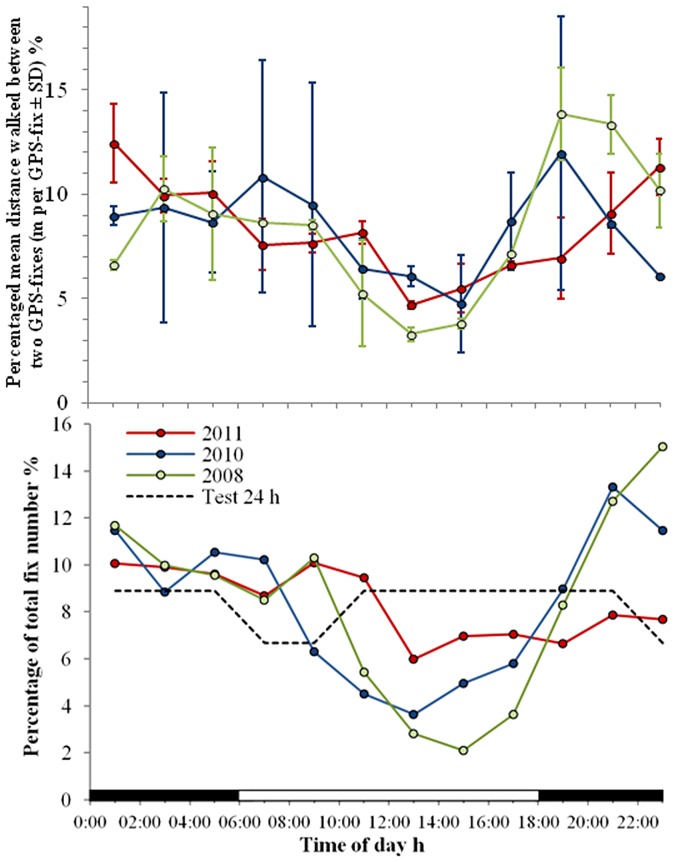
Figure 4. Circadian rhythm of locomotory behavior. Upper panel:
Relative activity = percentage of mean distances between GPS-fixes per total number of GPS-fixes ± SD [percentage of m/fix]. Horizontal bars indicate times of daylight (white) and night (black). Lower panel: Daily fluctuations of GPS fixes of all attached tags of the 2008, 2010, and 2011 missions (colored solid lines) and a stationary test tag (black dashed line). Data suggest that many animals hide in refuges during daytime thus blocking GPS reception. During the 2008 and 2010 missions (wet season) migratory activity of the animals begins at dusk to reach a maximum between 20:00 and 22:00.

