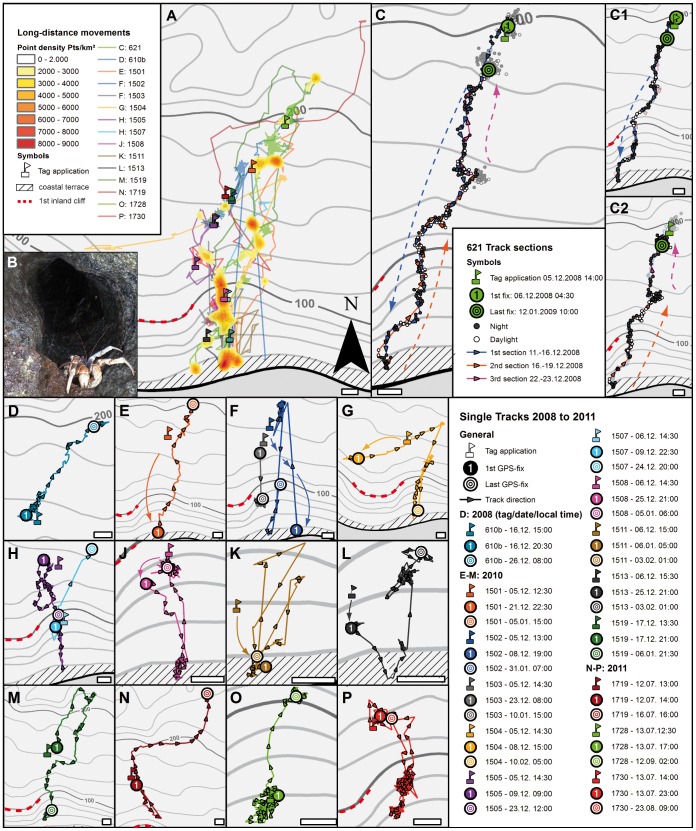
Figure 6. Long-distance Y-axis migrations.
A: Overview of all animals showing long-distance movements within a migratory corridor that extends from the coastal terrace ca. 2 km inland (data pooled from all three missions). Color ranges define point density estimates in points per km2 using only data of directed movements (points of stationary phases or undirected movements were removed) B: One of several animals exposed to ocean spray as observed in the upper openings of the blowholes at the coastal terrace (compare Fig. 1J). C: example of migratory animal No. 621, monitored from 5 December 2008 to 12 January 2009, and displaying typical Y-axis migration (with the X-axis being the shoreline) during this period. C1 and C2 section this migration into the outbound and inbound episodes. Note that in- and outbound paths are identical (permitting for the GPS error of max. 20 m); open symbols: daytime fixes, solid symbols: nighttime fixes. D–P: higher magnifications of all animals showing long-distance movements. For every animal, position and date (see boxed legend) of the tag application is plotted as well as dates and positions of the first and last obtained GPS fixes. Scale bars: 100 m.

