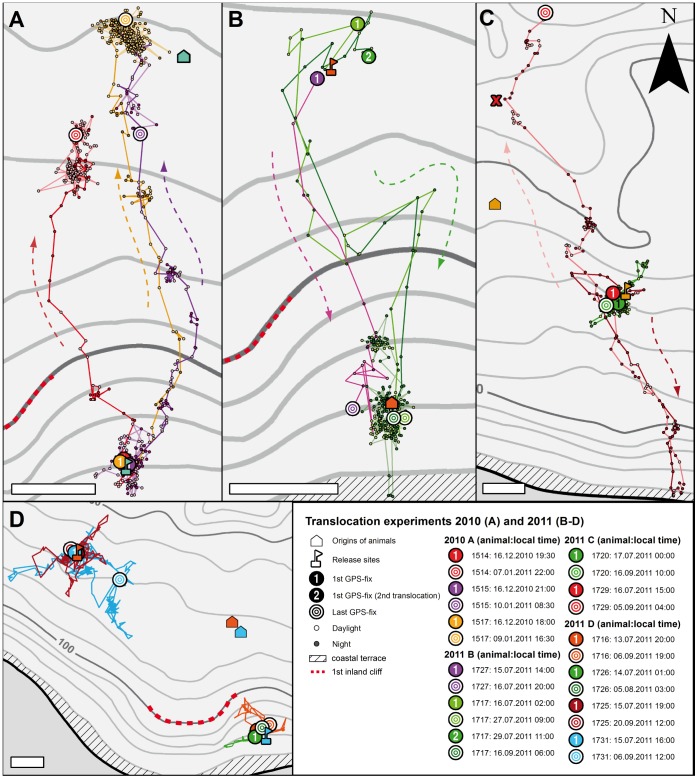
Figure 7. Displacement experiments and homing.
A, B: Homing course of animals that were picked up at the house symbols and translocated in Y-axis direction towards the flagged release sites in the south (A) or the north (B). For all animals, the date (see boxed legend) and position of the first and last GPS fixes are given in addition to the track. Note that animal No. 1717 (green in B) was translocated twice and both times homed back to its pick-up site on an identical path. C: Two animals that were picked up at the house symbols and translocated roughly parallel to the coast out of the migratory corridor towards the flagged release sites in the east. Whereas animal No. 1720 remained in the release area, No. 1729 migrated to the coast, but ca. 1.5 km east of the regular migratory corridor. It then reversed its path to migrate far north past the release site. D: Two animals, Nos. 1725 and 1731, translocated roughly parallel to the coast out of the migratory corridor towards the flagged release sites in the west did not home back to the pickup area (orange symbols). Two animals translocated from north to south (blue symbols) within the migratory corridor during the 2011 mission also remained within the release area. Scale bars: 200 m.

