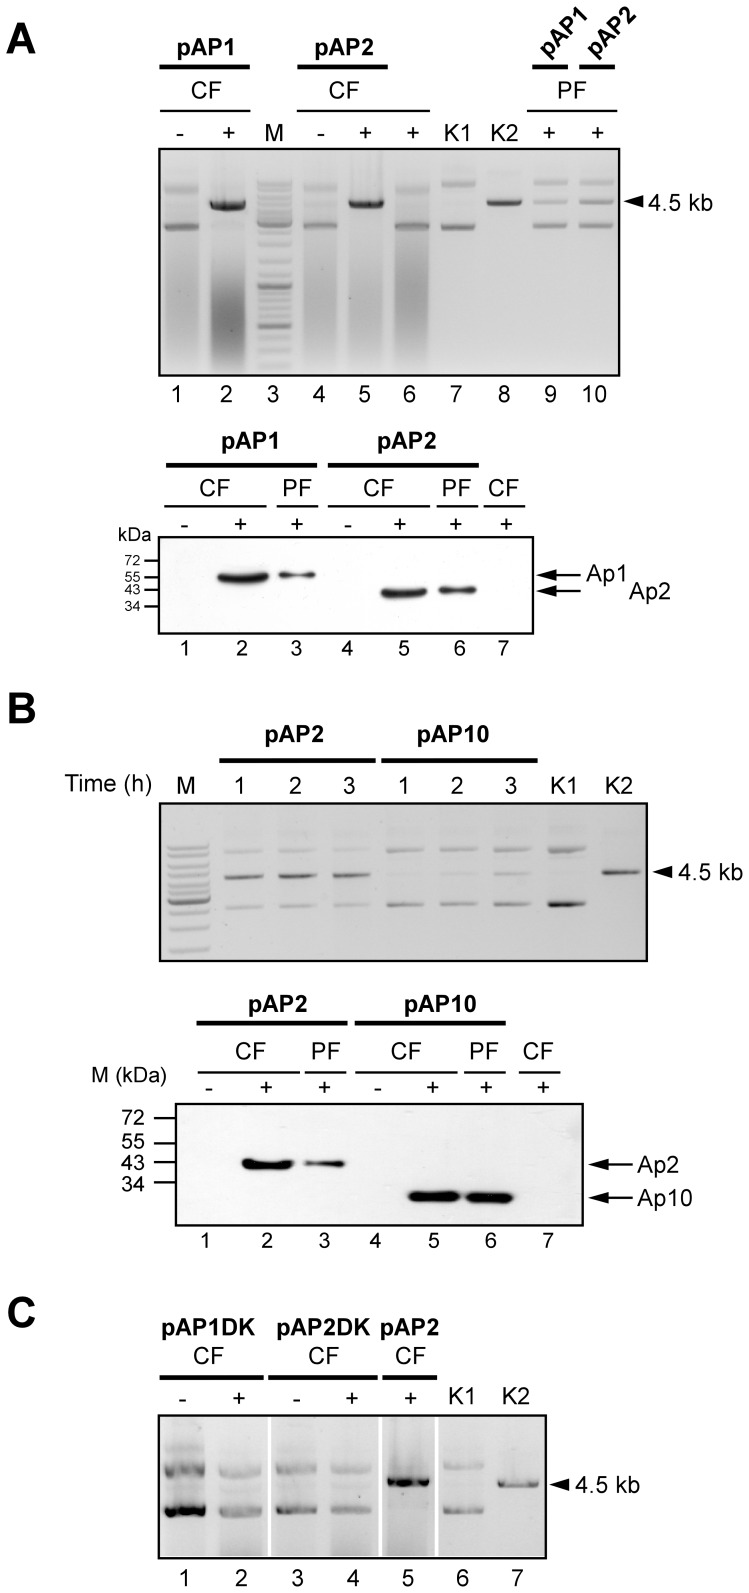
Figure 2. Enzymatic analysis of I-UmaI in dependence on the two LAGLIDADG domains.
(A) Cleavage analysis with crude fractions (CF) from either non-induced (−) or induced (+) pAP1 (1,2) and pAP2 (4,5) E. coli cells in the presence of substrate plasmid pSL521. CF from non-transformed E. coli cells incubated under inducing conditions served as a negative control (6). Cleavage analysis with purified fractions (PF) from induced pAP1 (9) and pAP2 (10) cells. DNA ladder: thick bands correspond to 500, 1000 and 3000 bp (3). The bands directly above 3 kb are 3.5, 4 and 5 kb. pSL521 uncut (K1) or linearized (K2) served as markers. The size of pSL521 is 4503 bp (arrowhead). Bottom panel: verification of I-UmaI expression. Protein fractions from either non-induced (-) or induced (+) cells were applied to SDS-PAGE for subsequent immunoblot analysis to detect His-tagged I-UmaI expressed in pAP1 (1–3; additional THX domain) and pAP2 (4–6) cells. CF from non-transformed E. coli cells incubated under inducing conditions served as a negative control (7). All lanes are from the same blot. The predicted molecular masses for AP1 and AP2 are 55.8 and 42.3 kDa, respectively. (B) Comparison between the enzymatic activities of I-UmaI (pAP2) and I-UmaImut (pAP10). PF from induced pAP2 or pAP10 cells was incubated with substrate plasmid pSL521 for 1, 2 and 3 h, respectively. The thick marker (M) band corresponds to 3 kb (see part A). Controls K1, K2 as in (A). Bottom panel: verification of I-UmaImut expression. Protein fractions from either non-induced (−) or induced (+) cells were applied to SDS-PAGE for subsequent immunoblot analysis to detect His-tagged I-UmaImut expressed in pAP10 cells (4–6). The corresponding fractions from pAP2 (1–3) and CF from induced, non-transformed E. coli served for controls (7). The predicted molecular mass for AP10 is 27.0 kDa. (A, B) Loaded protein amounts were 16–18 µg for CF and 0.23–0.34 µg for PF. (C) Analysis of AP1DK and AP2DK activities. CF from non-induced (−) or induced (+) pAP1DK (1,2) and pAP2DK (3,4) cells were incubated with substrate plasmid pSL521. The reaction with CF from induced pAP2 cells served for control (5). Controls K1, K2 as in (A). All lanes are from the same blot.

